

 Facebook
 X
X
 Pinterest
 Copy Link
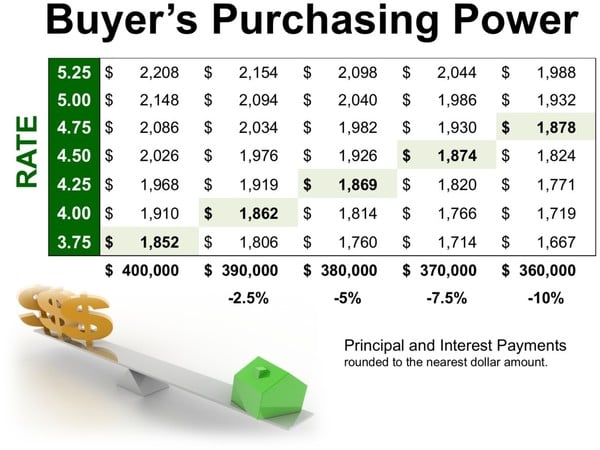
With each quarter of a percent increase in interest rate, the value of the home you can afford decreases by 2.5% (in this example, $10,000). Experts predict that mortgage rates will be closer to 5% by this time next year.
Housing Market News •
May 22, 2018
How Current Interest Rates Can Have a High Impact on Your Purchasing Power


According to Freddie Mac’s latest Primary Mortgage Market Survey, interest rates for a 30-year fixed rate mortgage are currently at 4.61%, which is still near record lows in comparison to recent history!
The interest rate you secure when buying a home not only greatly impacts your monthly housing costs, but also impacts your purchasing power.
Purchasing power, simply put, is the amount of home you can afford to buy for the budget you have available to spend. As rates increase, the price of the house you can afford to buy will decrease if you plan to stay within a certain monthly housing budget.
The chart below shows the impact that rising interest rates would have if you planned to purchase a home within the national median price range while keeping your principal and interest payments between $1,850-$1,900 a month.
Housing Market News •
May 21, 2018
Orange County Real Estate Market Report for May 2018
Green Team Business Review – May 2018
The numbers tell a story all their own. Despite the lack of inventory on the market, despite the specter of rising interest rates, loss of deductions due to new tax laws, etc., the Green Team is doing something very right and finding people buyers for their homes and finding homes for buyers! Both the Warwick and Vernon offices have more than doubled their sales volume from a year ago.
Orange County, NY Real Estate Market Report – April 2018 Results
The May Market Update was held on Tuesday, May 8 on Facebook Live. It was moderated by Geoff Green, Founder of Green Team Home Selling System. Panelists included sales agents Vikki Garby from the Warwick office, Keren Goren of the Vernon office, Michael Giannetto from Residential Home Funding and Ken Ford from Warwick Valley Financial Advisors.
If you missed the original live event, click here to watch. The discussion involved not only the housing market, but also perspectives on the economy. Our guest panelists have a great deal of knowledge and expertise, and the conversation was informative, educational and lively.
You can also sign up for monthly updates by email on the Green Team website.
We were experiencing technical difficulties:
Prior to the update going live, the following discussion took place:
The lack of inventory remains the biggest impediment to home sales, and the panel discussed the various reasons why people are reluctant to sell now. Vikki Garby stated that there were more buyers this winter than last spring, but that there is not a lot to buy. Cash buyers were coming in strong, with some people getting full asking price, or over. Keren Goren stated that many people she spoke to were just hanging on, waiting to see what would happen in the market.
Geoffrey Green told the panel that he is often asked, “Should I wait, because prices are going higher?” According to Vikki, sellers are worried about finding a home! People move up here from other places and swamp the market, and people who want to sell but stay in the area are concerned. Keren said that houses in Sussex are outdated, older than what buyers are looking for. Geoff said, “At the end of the day, if you’re moving and need to sell, try to sell and buy at the same time.”
The conversation turned to “fixer-uppers.” Geoff felt that most buyers don’t have the time, experience, and money to do renovation after buying a home. However, he asked the panel if they were seeing more buyers willing to take on a fixer-upper.
Keren cited a buyer who was willing to take out a loan to put a new roof on a house where everything else had been done. He was willing to go that step. Vikki stated there was not much to choose from and buyers trying to get into the area are having to be more flexible. Mike Giannetto stated that reno loans are now a big product and many people are taking the opportunity to fix up a house, put in new appliances, roof, etc., using equity.
Watch the video for more discussion, including a fascinating look into the world of economics and how the bond market impacts the interest rate that buyers may soon be paying.
Orange County, NY Real Estate Market Report – April 2018 Results
We are pleased to share with you the Housing Market Report for April 2018. We break down local real estate activities and provide you with stats, graphs, and analysis of our local and regional real estate market. In addition, we provide insight from some of the people most familiar with market trends: sales associates, mortgage funding specialists and financial advisers.
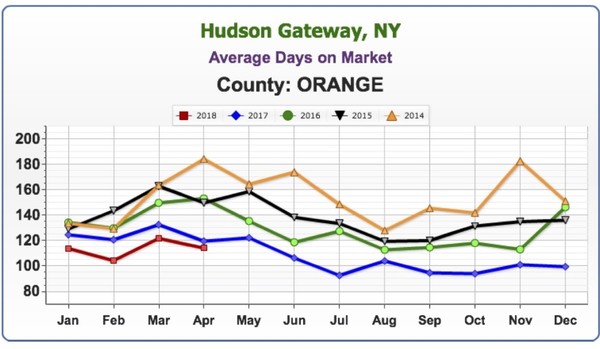
Average Days on the Market
The faster homes are selling, the hotter the market. Look for the lowest number on the graph, as opposed to the highest. The calculation in New York State is from the List Date to the Contract Date.
With numbers in for April, the average days on are the lowest they’ve been for this month for 5 years.
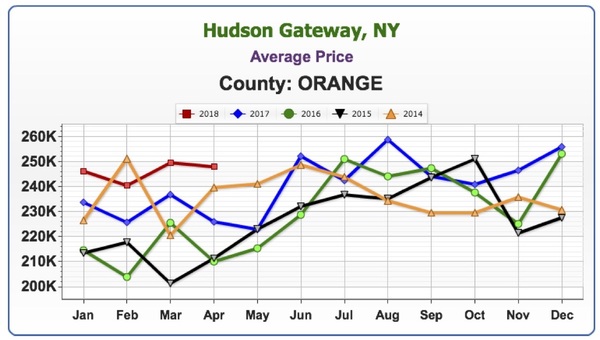
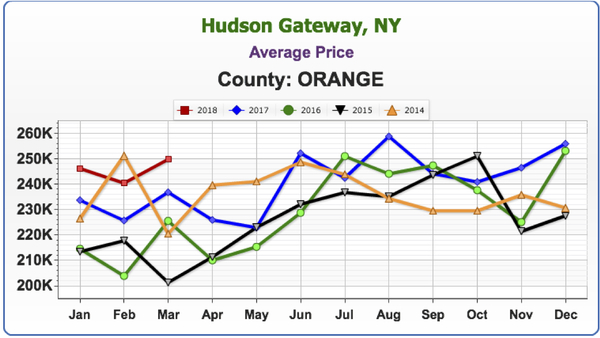
Average Price
Here again we’re seeing a trend. Prices are coming in at their highest point for April in 5 years, at an average of $247,849.
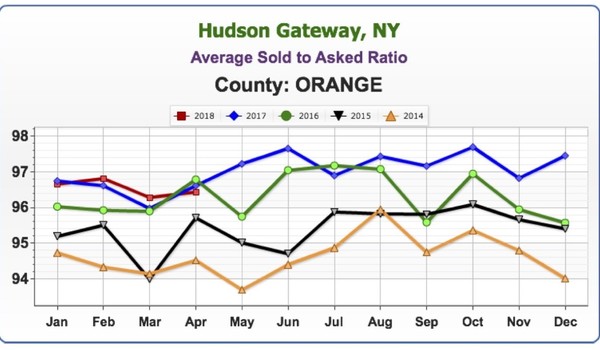
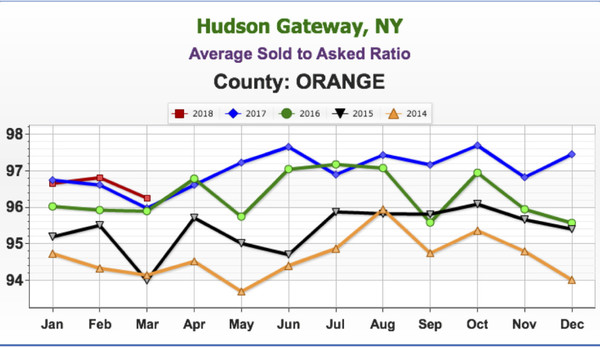
Average Sold to Asked Ratio
This is the percentage a house sold for under or over the last asking (not the original) price.
The higher the percentage, the hotter the market. This April the percentage dipped slightly below April 2016 and 2017, but sellers are still negotiating at approximately 3.5 points off the last asking price. As mentioned last month, this is an average of all of Orange County, with some areas having a higher percentage, and some a lower one.
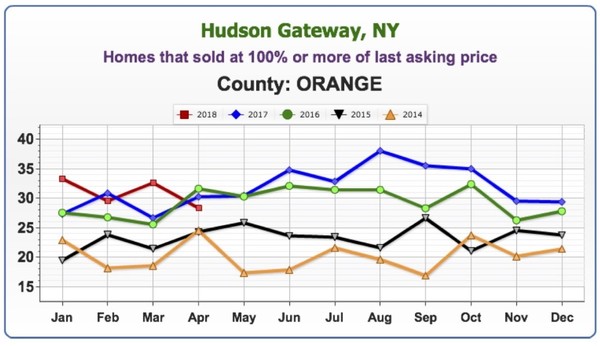
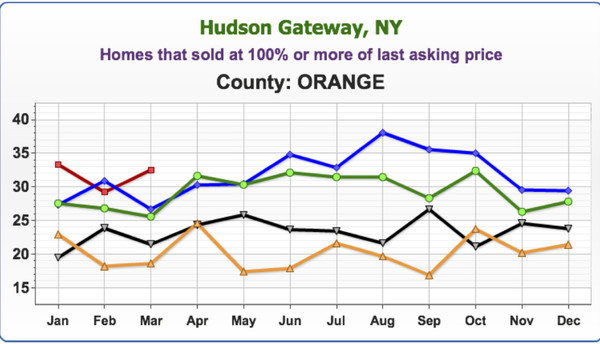
Homes that sold at 100% or more of last asking price
Here again there was a slight dip below April 2016 and 2017, though the numbers remain higher than 2014 and 2015.
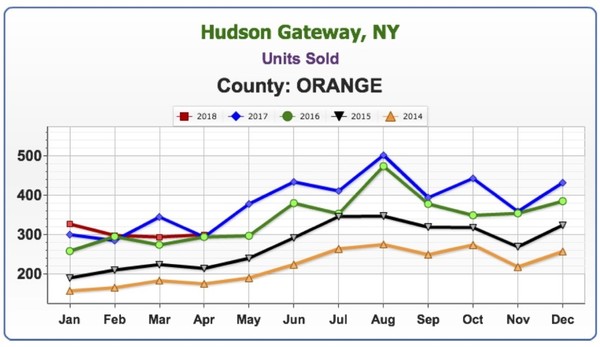
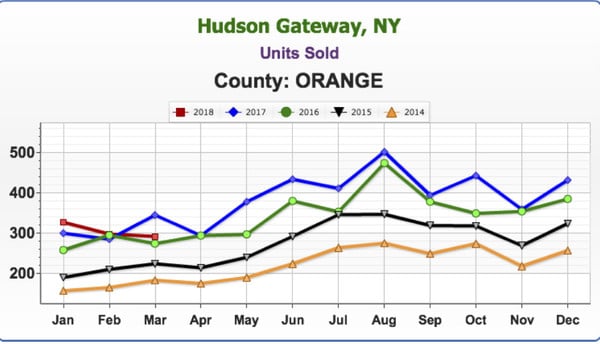
Units Sold
Units sold seems to have flat lined; however, more units were sold in April 2018 than in the four preceding years.
We Keep You Informed:
The Green Team Shares this information and more each month during our Live Housing Market Update. Register to join the webinar and hear directly from our participating Green Team Sales Associates who share their personal take on how the marketplace is doing.
Each month we are also joined by industry experts who share insights into the current financing environment as well as broader economic issues affecting the housing market.
Check out our past Housing Market Updates. Then Register to join our next one on June 12th at 9am.
[embedyt] https://www.youtube.com/embed?listType=playlist&list=PL6MEM7EpyL0E5YdU249T_KsDQTukboj8E&v=AQYblgrxmIY[/embedyt]
Housing Market News •
May 21, 2018
Sussex County Real Estate Market Report for May 2018
Green Team Business Review – May 2018
The numbers tell a story all their own. Despite the lack of inventory on the market, despite the specter of rising interest rates, loss of deductions due to new tax laws, etc., the Green Team is doing something very right and finding people buyers for their homes and finding homes for buyers! Both the Warwick and Vernon offices have more than doubled their sales volume from a year ago.
Sussex County, NJ Real Estate Market Report – April 2018 Results
The May Market Update was held on Tuesday, May 8 on Facebook Live. It was moderated by Geoff Green, Founder of Green Team Home Selling System. Panelists included sales agents Vikki Garby from the Warwick office, Keren Goren of the Vernon office, Michael Giannetto from Residential Home Funding and Ken Ford from Warwick Valley Financial Advisors.
If you missed the original live event, click here to watch. The discussion involved not only the housing market, but also perspectives on the economy. Our guest panelists have a great deal of knowledge and expertise, and the conversation was informative, educational and lively.
You can also sign up for monthly updates by email on the Green Team website.
We were experiencing technical difficulties:
Prior to the update going live, the following discussion took place:
The lack of inventory remains the biggest impediment to home sales, and the panel discussed the various reasons why people are reluctant to sell now. Vikki Garby stated that there were more buyers this winter than last spring, but that there is not a lot to buy. Cash buyers were coming in strong, with some people getting full asking price, or over. Keren Goren stated that many people she spoke to were just hanging on, waiting to see what would happen in the market.
Geoffrey Green told the panel that he is often asked, “Should I wait, because prices are going higher?” According to Vikki, sellers are worried about finding a home! People move up here from other places and swamp the market, and people who want to sell but stay in the area are concerned. Keren said that houses in Sussex are outdated, older than what buyers are looking for. Geoff said, “At the end of the day, if you’re moving and need to sell, try to sell and buy at the same time.”
The conversation turned to “fixer-uppers.” Geoff felt that most buyers don’t have the time, experience, and money to do renovation after buying a home. However, he asked the panel if they were seeing more buyers willing to take on a fixer-upper.
Keren cited a buyer who was willing to take out a loan to put a new roof on a house where everything else had been done. He was willing to go that step. Vikki stated there was not much to choose from and buyers trying to get into the area are having to be more flexible. Mike Giannetto stated that reno loans are now a big product and many people are taking the opportunity to fix up a house, put in new appliances, roof, etc., using equity.
Watch the video for more discussion, including a fascinating look into the world of economics and how the bond market impacts the interest rate that buyers may soon be paying.
Sussex County, NJ Real Estate Market Report – April 2018 Results
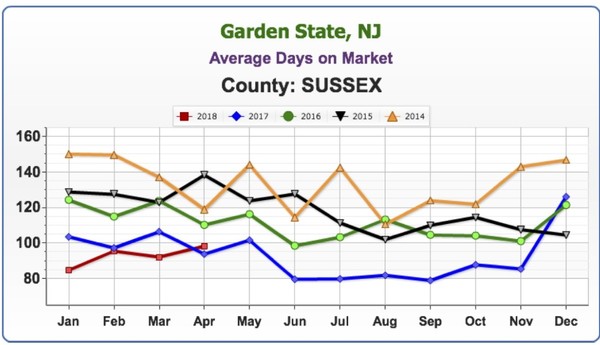
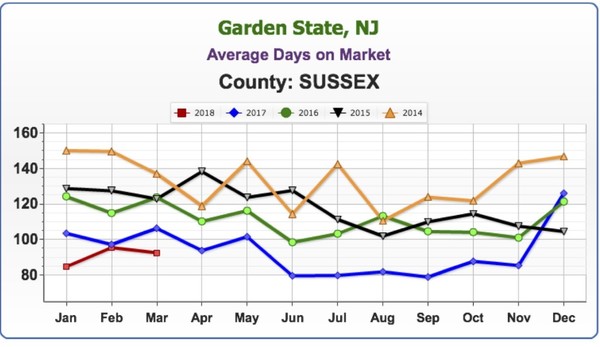
Average Days on the Market
The faster homes are selling, the hotter the market. Look for the lowest number on the graph, as opposed to the highest.
The average days on the market are slightly higher than April of 2017 but are way below the previous three years. The average number of days on the market is 92.57 for the first four months of 2018.
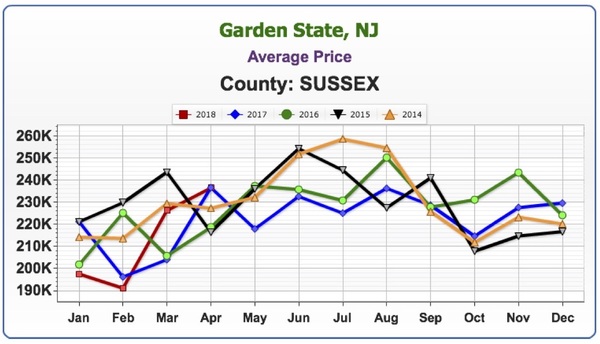
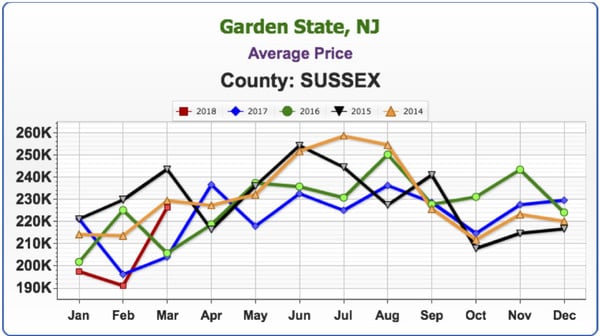
Average Price
The average price is just about where it was this time last year and is above the prior three years.
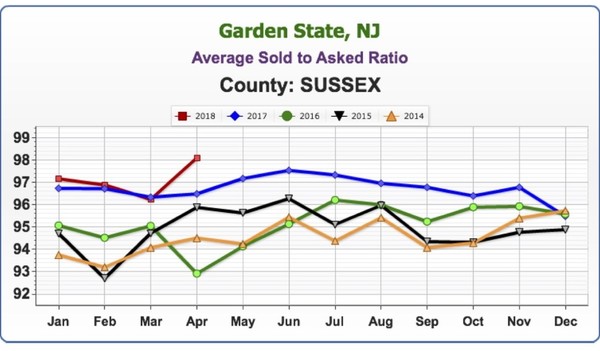
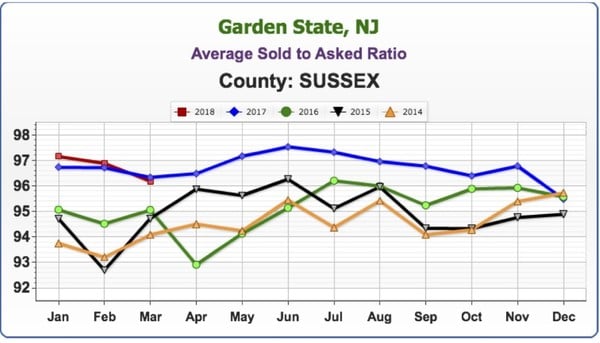
Average Sold to Asked Ratio
This is the percentage a house sold for under or over the last asking (not the original) price.
There was a jump in this number, with the percentage at 98.98% for this April, the highest point for any month in the past five years. Sellers were negotiating at approximately 2 points off the last asking price.
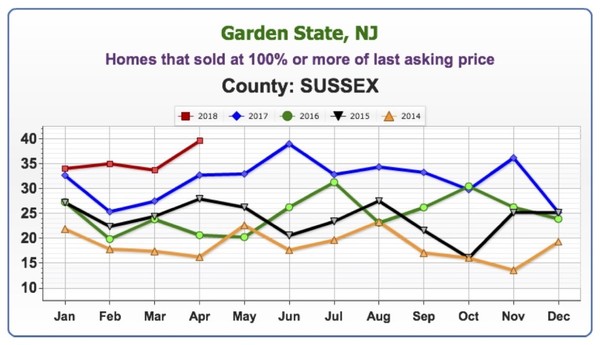
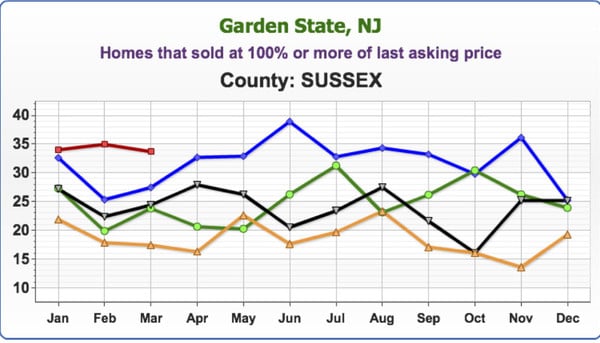
Homes that sold at 100% or more of last asking price
Here again there was a jump in the numbers, reaching the highest point for any month in the past 5 years.
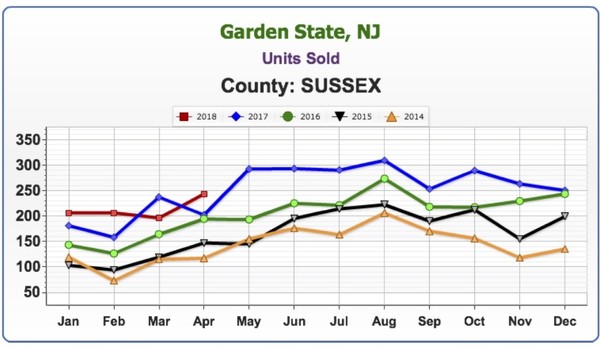
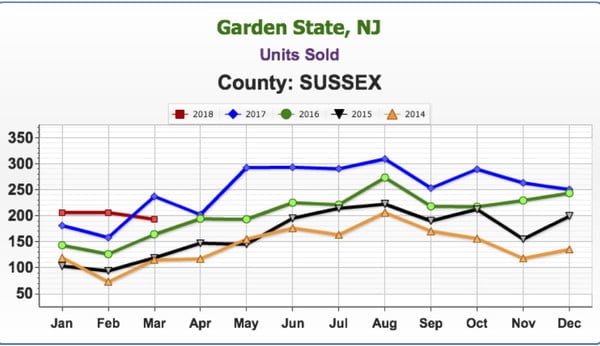
Units Sold
There was a climb in the numbers here, as well, with April 2018 showing the most units sold for this month over the past four years.
We Keep You Informed:
The Green Team Shares this information and more each month during our Live Housing Market Update. Register to join the webinar and hear directly from our participating Green Team Sales Associates who share their personal take on how the marketplace is doing.
Each month we are also joined by industry experts who share insights into the current financing environment as well as broader economic issues affecting the housing market.
Check out our past Housing Market Updates. Then Register to join our next one on June 12th at 9am.
[embedyt] https://www.youtube.com/embed?listType=playlist&list=PL6MEM7EpyL0E5YdU249T_KsDQTukboj8E&v=AQYblgrxmIY[/embedyt]
Housing Market News •
May 13, 2018
How Much Has Your Home Increased in Value Over the Last Year?


Home values have risen dramatically over the last twelve months. In CoreLogic’s most recent Home Price Index Report, they revealed that national home prices have increased by 6.7% year-over-year.
CoreLogic broke down appreciation even further into four price ranges, giving us a more detailed view than if we had simply looked at the year-over-year increases in national median home price.
The chart below shows the four price ranges from the report, as well as each one’s year-over-year growth from February 2017 to February 2018 (the latest data available).
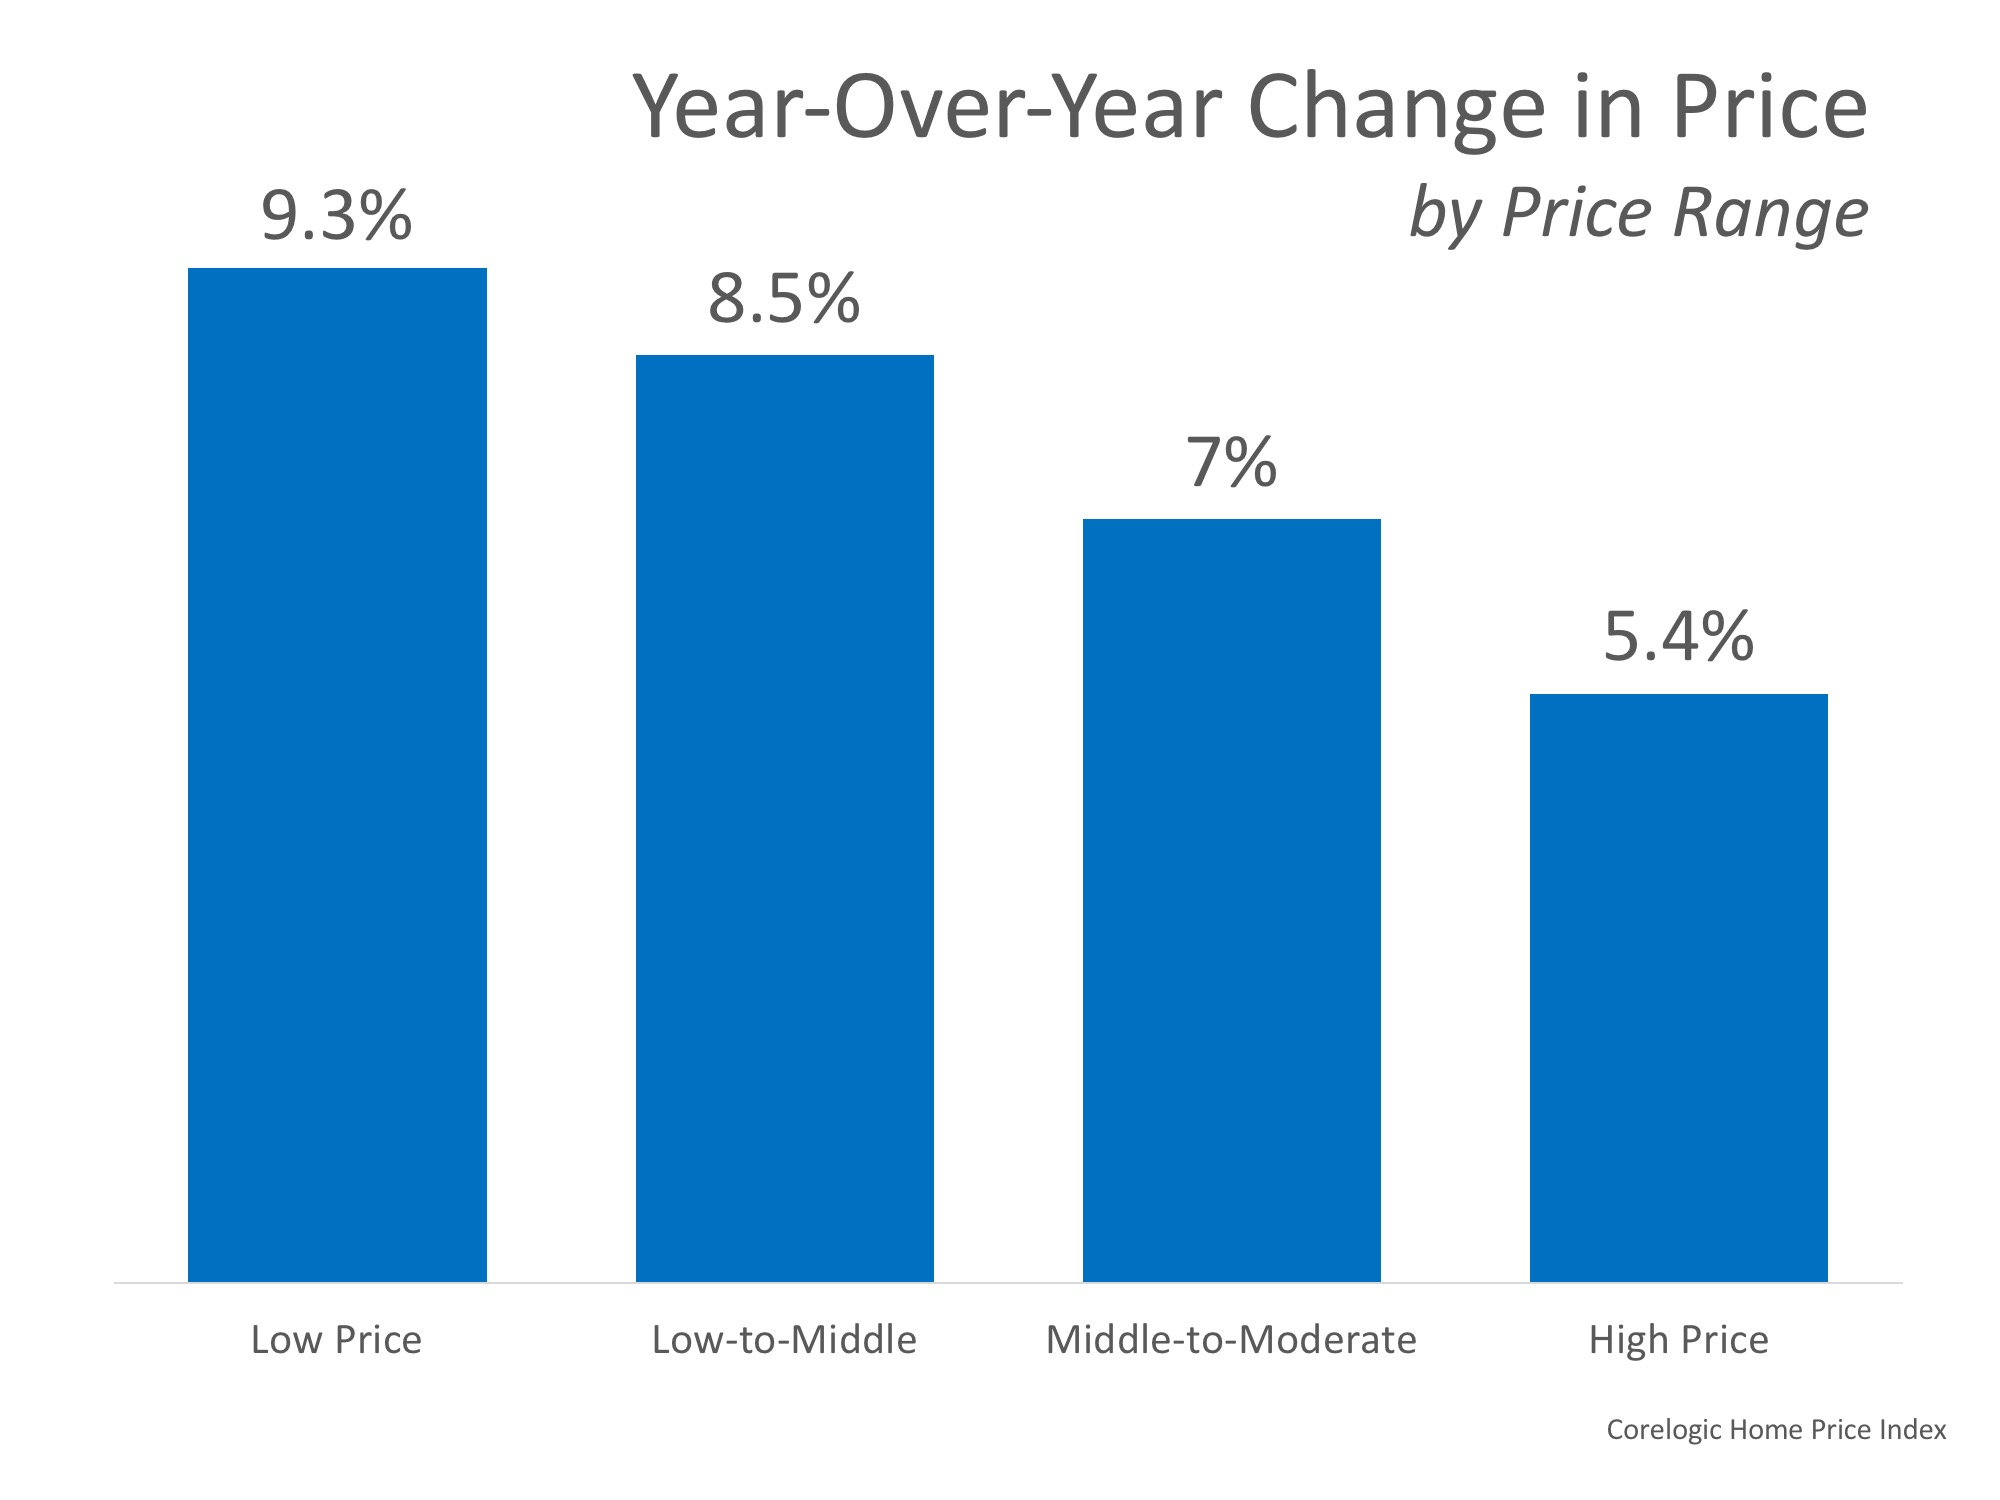
It is important to pay attention to how prices are changing in your local market. The location of your home is not the only factor that determines how much your home has appreciated over the course of the last year.
Lower-priced homes have appreciated at greater rates than homes at the upper ends of the spectrum due to demand from first-time home buyers and baby boomers looking to downsize.
Bottom Line
If you are planning to list your home for sale in today’s market, let’s get together to go over exactly what’s going on in your area and your price range or start by getting your free home value estimate today. It’s quick and free – Click Here
Housing Market News •
May 13, 2018
5 Ways Tax Reform Has Impacted the 2018 Housing Market


5 Ways Tax Reform Has Impacted the 2018 Housing Market
Starting late last year, some predicted that the 2018 tax changes would cripple the housing market. Headlines warned of the potential for double-digit price depreciation and suggested that buyer demand could drop like a rock. There was even sentiment that homeownership could lose its coveted status as a major component of the American Dream.
Now that the first quarter numbers are in, we can begin to decipher the actual that impact tax reform has had on the real estate market.
1. Has tax reform killed off home buyer demand? The answer is “NO.”
According to the Showing Time Index which “tracks the average number of buyer showings on active residential properties on a monthly basis” and is a “highly reliable leading indicator of current and future demand trends,” buyer demand has increased each month over the last three months and is HIGHER than it was for the same months last year. Buyer demand is not down. It is up.
2. Have the tax changes affected America’s belief in real estate as a long-term investment? The answer is “NO.”
Two weeks ago, Gallup released its annual survey which asks Americans which asset they believed to be the best long-term investment. The survey revealed:
“More Americans name real estate over several other vehicles for growing wealth as the best long-term investment for the fifth year in a row. Just over a third cite real estate for this, while roughly a quarter name stocks or mutual funds.”
The survey also showed that the percentage of Americans who believe real estate is the best long-term investment was unchanged from a year ago.
3. Has the homeownership rate been negatively impacted by the tax changes? The answer is “NO.”
Not only did the homeownership rate not crash, it increased when compared to the first quarter of last year according to data released by the Census Bureau.
In her latest “Z Report,” Ivy Zelman explains that tax reform didn’t hurt the homeownership rate, but instead, enhanced it:
“We have been of the opinion that homeownership is most highly correlated with income and the net effect of tax reform would be a positive, rather than negative catalyst for the homeownership rate. While still in the early innings of tax changes, this has proven to be the case.”
4. Has the upper-end market been crushed by new State and Local Taxes (SALT) limitations? The answer is “NO.”
In the National Association of Realtors latest Existing Home Sales Report it was revealed that:
* Sales between $500,000 and $750,000 were up 4.5% year-over-year
* Sales between $750,000 and $1M were up 15.1% year-over-year
* Sales over $1M were up 17.3% year-over-year
5. Will the reforms in the tax code cause home prices to tumble over the next twelve months? The answer is “NO.”
According to CoreLogic’s latest Home Price Insights Report, home prices will appreciate in each of the 50 states over the next twelve months. Appreciation is projected to be anywhere from 1.9% to 10.3% with the national average being 4.7%.
Bottom Line
The doomsday scenarios that some predicted based on tax reform fears seem to have already blown over based on the early housing industry numbers being reported.
Get the latest News and Advice on your local market – Sign up for our Monthly Market Updates Today
[gravityform id=”16″ title=”true” description=”true”]
Selling a Home •
May 8, 2018
Balancing Emotions When Selling Your Home…

[et_pb_section admin_label=”section”]
[et_pb_row admin_label=”row”]
[et_pb_column type=”4_4″][et_pb_text admin_label=”Text”]
 Balancing emotions when selling your home… without losing your mind!
 Balancing emotions when selling your home… without losing your mind!
The day has come. You’ve decided to list and sell your home and embrace a new beginning. Now comes the emotional roller coaster ride that everyone goes through. You are not alone. Understanding the phases involved will help you in balancing emotions so that you can overcome the ties that bind you.
Phase 1: Excitement
Excitement starts the early wave of emotions when you’ve made the decision to sell and are getting ready for your next venture and new beginning. The stars are aligned.
Phase 2: Second Thoughts
Second thoughts are the silent partner of anxiety. Will my home sell? How long will it take? Is it priced right? Why don’t buyers see the value in my home? Why did that one sell and not mine? These thoughts will run through your mind on a daily basis. Don’t let them!!! Your home will sell to the buyer who is meant to have it. It’s that simple. Don’t overthink the process. Leave that to your realtor.
Phase 3: Buyer Feedback
Buyer feedback! The Good, the Bad and the Ugly, are opinions that are not about you, but the experience buyers had while viewing your house. Take note, make adjustments, and forge forward. Remember, not every home is for every buyer. Improve the showing experience for the next showing.
Phase 4: It’s worth more than that!
It’s worth more than that! You’re frustrated and annoyed the offer received was below list price. It’s a starting point to continue further discussion. Don’t get offended! Seize the opportunity of buyer interest.
Phase 5: Inspections, contracts and appraisal… OH MY!
Inspections, contracts and appraisal… OH MY! Calm heads will always prevail. You are only allowed to panic when I tell you to” is a rule to be followed. You can’t stress the unknown variables. They will balance out. Leave that to the team you hired.
Phase 6: Relief, excitement and melancholy…
Relief, excitement and melancholy all rolled into the closing day and accompanied by exhaustion. Not that it’s laborious, but emotional! Remember you started the process with the goal to get you where you need to be, and now that it’s finally here, it’s a win/win!
Expecting these emotions to surface will help you understand it’s not just happening to you! Limit stress factors with preparation and by hiring an experienced realtor to safeguard a smooth transaction in your home sale.
[/et_pb_text][/et_pb_column]
[/et_pb_row]
[/et_pb_section]
Housing Market News •
May 4, 2018
4 Reasons Why Today’s Housing Market is NOT 2006 All Over Again


With home prices rising again this year, some are concerned that we may be repeating the 2006 housing bubble that caused families so much pain when it collapsed. Today’s market is quite different than the bubble market of twelve years ago. There are four key metrics that explain why:
- Home Prices
- Mortgage Standards
- Mortgage Debt
- Housing Affordability
1. HOME PRICES
There is no doubt that home prices have reached 2006 levels in many markets across the country. However, after more than a decade, home prices should be much higher based on inflation alone.
Frank Nothaft is the Chief Economist for CoreLogic (which compiles some of the best data on past, current, and future home prices). Nothaft recently explained:
“Even though CoreLogic’s national home price index got to the same level it was at the prior peak in April of 2006, once you account for inflation over the ensuing 11.5 years, values are still about 18% below where they were.” (emphasis added)
2. MORTGAGE STANDARDS
Some are concerned that banks are once again easing lending standards to a level similar to the one that helped create the last housing bubble. However, there is proof that today’s standards are nowhere near as lenient as they were leading up to the crash.
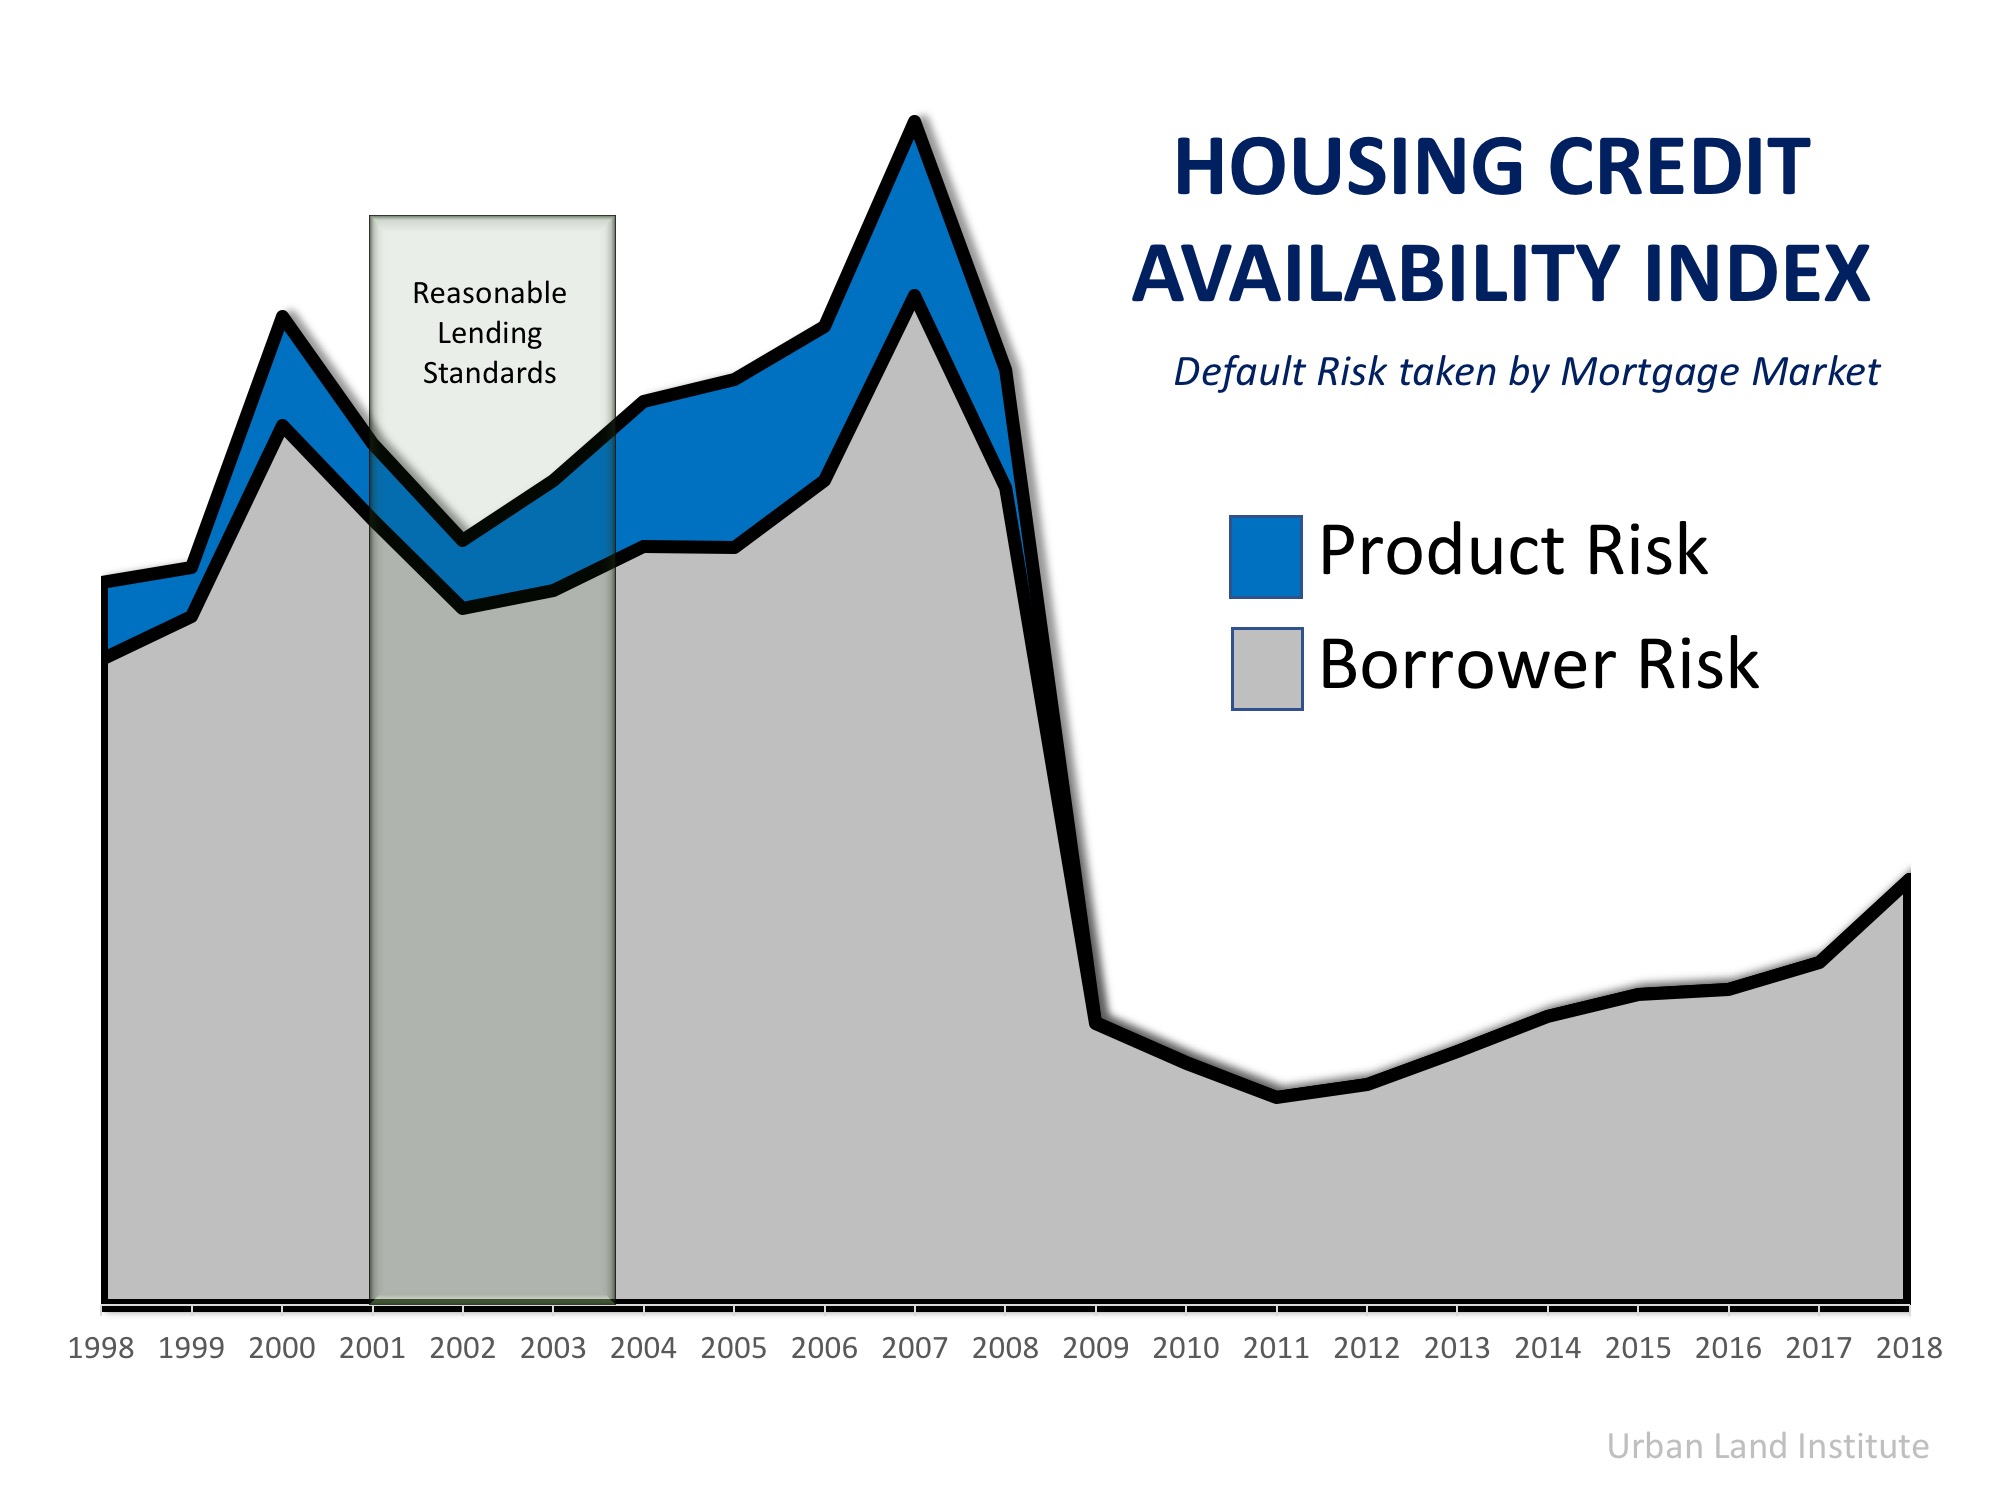
The Urban Institute’s Housing Finance Policy Center issues a Housing Credit Availability Index(HCAI). According to the Urban Institute:
“The HCAI measures the percentage of home purchase loans that are likely to default—that is, go unpaid for more than 90 days past their due date. A lower HCAI indicates that lenders are unwilling to tolerate defaults and are imposing tighter lending standards, making it harder to get a loan. A higher HCAI indicates that lenders are willing to tolerate defaults and are taking more risks, making it easier to get a loan.”
The graph below reveals that standards today are much tighter on a borrower’s credit situation and have all but eliminated the riskiest loan products.
3. MORTGAGE DEBT
Back in 2006, many homeowners mistakenly used their homes as ATMs by withdrawing their equity and spending it with no concern for the ramifications. They overloaded themselves with mortgage debt that they couldn’t (or wouldn’t) repay when prices crashed. That is not occurring today.
The best indicator of mortgage debt is the Federal Reserve Board’s household Debt Service Ratio for mortgages, which calculates mortgage debt as a percentage of disposable personal income.
At the height of the bubble market a decade ago, the ratio stood at 7.21%. That meant over 7% of disposable personal income was being spent on mortgage payments. Today, the ratio stands at 4.48% – the lowest level in 38 years!
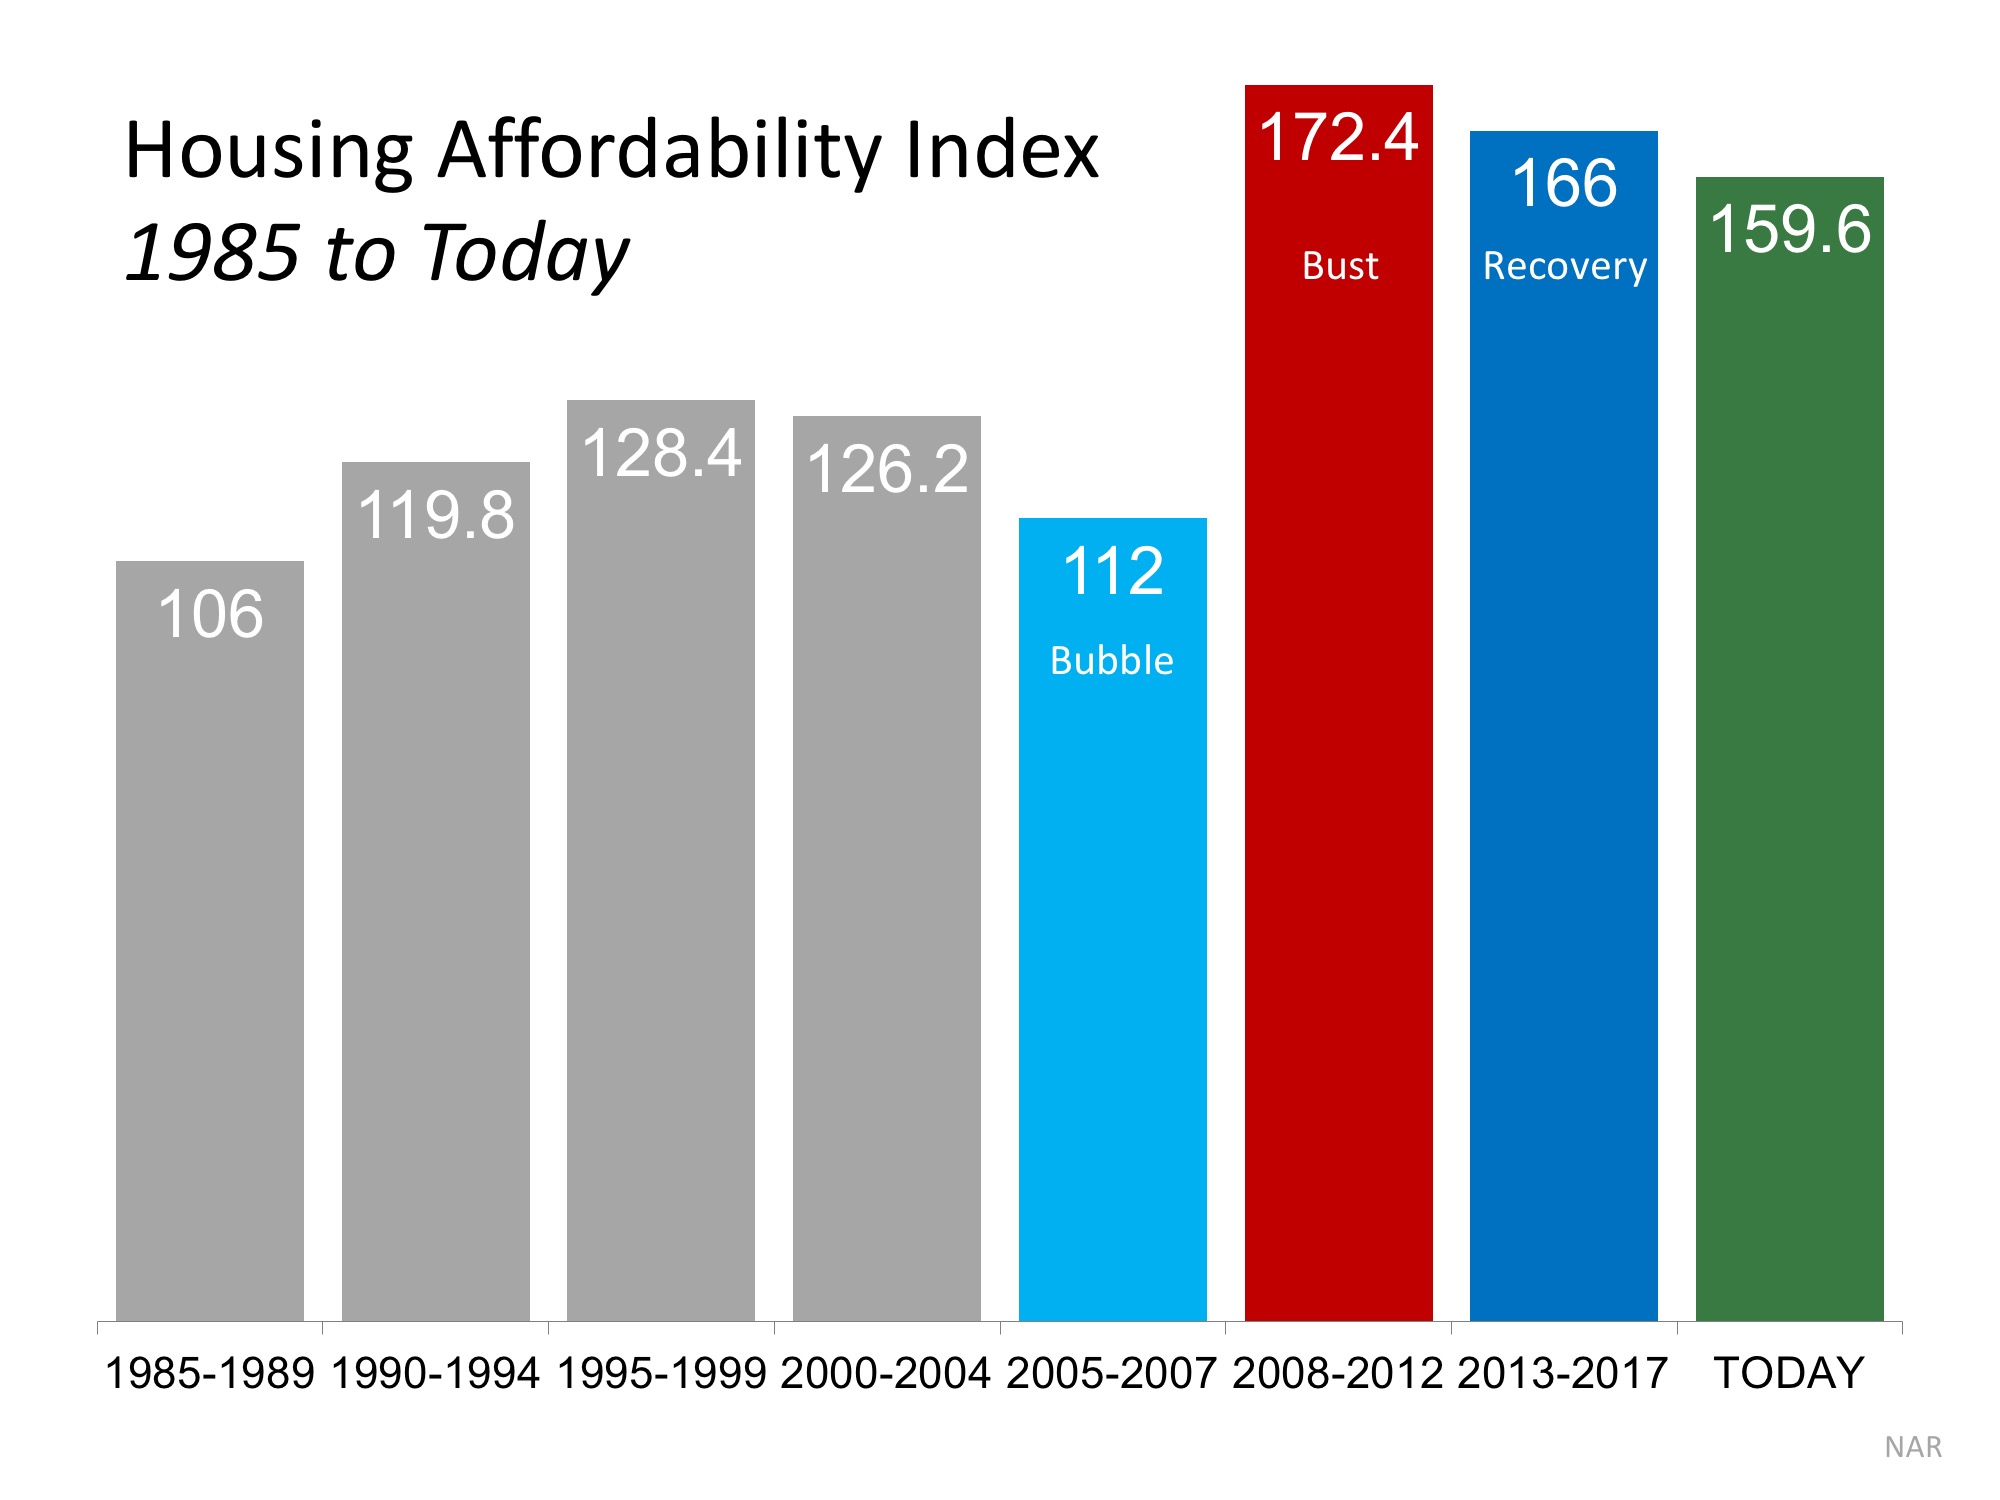
4. HOUSING AFFORDABILITY
With both house prices and mortgage rates on the rise, there is concern that many buyers may no longer be able to afford a home. However, when we look at the Housing Affordability Index released by the National Association of Realtors, homes are more affordable now than at any other time since 1985 (except for when prices crashed after the bubble popped in 2008).
Bottom Line
After using four key housing metrics to compare today to 2006, we can see that the current market is not anything like the bubble market.
Housing Market News •
May 3, 2018
Sussex County Real Estate Market Report for April 2018
Green Team Business Review – April 2018
There has been a lot of excitement at the Green Team lately. Much of it was generated by the Launch Competition, which was a tremendous success this year. You can read about this annual contest, its goals, the winners, and the prizes here. In addition, Joyce Rogers was named the recipient of the First Quarter Sales Leader Award for the Vernon office.
Making Market Updates More Informative and More Accessible
While it seems that would be enough to report, there’s more. The Green Team strives to bring its agents and its clients up-to-date market information as well as insights into the mortgage market, events that impact interest rates, and more. To provide all this information in an expanded, far-reaching format, the Green Team is going Live on Facebook!
Sussex County, NJ Real Estate Market Report – March 2018 Results
We are pleased to share with you the Housing Market Report for March 2018. We break down local real estate activities and provide you with stats, graphs, and analysis of our local and regional real estate markets. The April Market Update was held Tuesday, April 17 on Facebook Live. It was moderated by Geoff Green, the Broker/Manager of Green Team Home Selling System. Panelists included sales agents Barbara Tesa and Keren Gonen. In addition, Jeremy Miller of First Home Bank provided insights on mortgage and housing industry stats. Dan Habib, of MBS Highway, a firm that provides insight and analytics to industries, discussed where interest rates are headed and the topic of affordability. Watch the video on our Facebook page to hear what these experts had to share.
Also, you can sign up on the Green Team website to receive monthly updates by email.
Average Days on the Market
The faster homes are selling, the hotter the market. Look for the lowest number on the graph, as opposed to the highest.
We take a snapshot of the past 5 years and see how the current market compares. The average number of days on the market is the lowest it’s been for March since 2014, coming in at 92.51 days. This is great news for sellers, but not such good news for buyers.
Average Sold to Asked Ratio
The percentage a house sold for under or over the last asking price (not the original price).
The Average Sold to Asked Ratio has been closely tracking 2017 numbers and is above the prior three years.
Homes that sold at 100% or more of last asking price
The first 3 months of 2018 have consistently been higher than the previous four years. In March almost 35 percent of homes sold at 100% or more of their last asking price..
Average Price
There have been some interesting stats on average price. February 2018 was the lowest month in 5 years, but the March numbers are climbing up, higher than March 2016 and 2017, closing in on 2014, and and trying to close the gap with 2015’s numbers.
Barbara stated that so many homes are at or below the $200,000 mark that they’re dragging down the County average. There are also foreclosures below $100,000 that need so much work they’re just tear downs. Add the underwater inventory, short sales or foreclosures into the mix and that further brings down the average. According to Keren, banks are getting smarter, spending $20,000 to paint, put in new kitchen, flooring, or trying to make a house a little more acceptable. However, more often than not, the house is not in good enough condition for new buyers.. Buyers are willing to pay more, but don’t want to pay more when they see mold, etc. Banks are putting houses up at prices too high for flippers to purchase, flip and make a profit on. When a foreclosure does come up that is in good condition, intense bidding wars ensue.
Units Sold
March dipped below the number of units sold in 2017, though it remained higher than the previous three years.
Keren stated that the banks have been holding on to inventory, waiting to release foreclosures in the spring market for a higher return on their investment. They’re thinking things are bad right now, so let’s just hold on and wait for the spring market. Keren Goren has experience in real estate investment, flipping homes, etc., so she brings a valuable perspective to the conversation.
Next Market Update
Mark your calendars and join us on Tuesday, May 8 at 9:15 a.m. for our next Facebook Live Market Update. Our special guests will be Michael Giannetto of Residential Home Financing, who will be offering substantive updates on the mortgage market and Ken Ford of Warwick Valley Financial Advisors, who will discuss other economic factors impacting the housing market. If you can’t make it at 9:15, be sure to watch the video later!
Housing Market News •
May 3, 2018
Orange County Real Estate Market Report for April 2018
Green Team Business Review – April 2018
There has been a lot of excitement at the Green Team lately. Much of it was generated by the Launch Competition, which was a tremendous success this year. You can read about this annual contest, its goals, the winners and the prizes here. Then Lucyann Tinnirello was selected as the new Broker Manager of the Warwick office. In addition, Nancy Sardo was named the recipient of the First Quarter Sales Leader Award in Warwick.
Making Market Updates More Informative and More Accessible
While it seems that would be enough to report, there’s more. The Green Team strives to bring its agents and its clients up-to-date market information as well as insight into the mortgage market, events that impact interest rates, and more. To provide all this information in an expanded, far-reaching format, the Green Team is going Live on Facebook.
Orange County, NY Real Estate Market Report – March 2018 Results
We are pleased to share with you the Housing Market Report for March 2018. We break down local real estate activities and provide you with stats, graphs, and analysis of our local and regional real estate market. The April Market Update was held Tuesday, April 17 on Facebook Live. It was moderated by Geoff Green, the Broker/Manager of Green Team Home Selling System. Panelists included sales agents Vikki Garby and Jacqueline Kraszewski. In addition, Jeremy Miller of First Home Bank provided insights on mortgage and housing industry stats. Dan Habib, of MBS Highway, a firm that provides insight and analytics to industries, discussed where interest rates are headed and the topic of affordability. Watch the video on our Facebook page to hear what these experts had to share.
Also, you can sign up on the Green Team website to receive a monthly update by email.
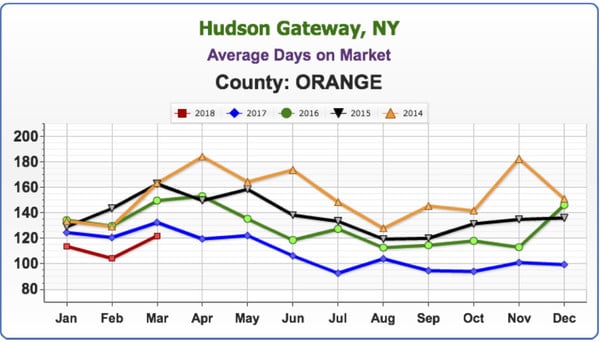
Average Days on the Market
The faster homes are selling, the hotter the market. Look for the lowest number on the graph, as opposed to the highest. The calculation in New York State is from the List Date to the Contract Date.
We take a snapshot of the past 5 years and see how the current market compares. The average number of days on the market is the lowest it’s been for March since 2014. This shows a stronger market for sellers. However, it’s not the best news for buyers.
Average Price
Prices have not been on the comeback for some time, but last June they started to rise and are now coming out of the gate significantly higher. According to Geoff, inventory continues to be a big problem. He thinks that one of the issues is that some sellers still can’t get out of their homes based on refinancing they did ten years ago. They just can’t sell until prices rise, and he believes that will be the key to unlocking inventory.
Jacqueline stated there are just not enough houses out there to show. The average length of time that most people stay in a house is ten years, and ten years ago was when the market really crashed. Some people are still underwater and either can’t get out, or don’t want to just break even; they’d like to make a profit.
Vikki added that this year some things are helping. Last year appraisals were hurting the market. This year they seem to be getting more realistic based on what is actually happening in the market. There is very little supply for the demand. Market traffic was higher in February 2018 than it was in May of 2017. Sellers are feeling their strength and power in this market. Even banks are seeing the market potential and wanting to get in on the act, raising prices on properties they would have sold at much lower prices in previous markets. Vikki has experience in real estate investing, flipping homes, etc., so she brings a valuable perspective to the conversation.
Geoff mentioned that some banks are even holding their position in inventory and renting out units, something which is highly unusual. Banks generally unload inventory. For them to hold and rent is almost unheard of.
Average Sold to Asked Ratio
The percentage a house sold for under or over the last asking price (not the original price).
The higher the percentage, the hotter the market. Again, March 2018 is outpacing the last 4 years, with sellers negotiating approximately 3.5 points off their last asking price. It’s important to remember that this is an average of all Orange County; in some areas the percentage will be higher and in others, lower.
Homes that sold at 100% or more of last asking price
Again, the numbers continue to rise. March 2018 is the highest it’s been since 2014, with almost 35% of homes going for 100% or more of the last asking price. In other words, expect bidding wars!
Units Sold
There hasn’t been a dip from the previous year in many years. However less homes were sold in March than in previous years. Vikki felt that people closing in March were closing on those deals made in December and January, when inventory was way down.
Jacque stated that the market is hard on people starting out, those buyers in the under $300,000 range. There is not much available at that price point, and if there is something, it’s usually a total handyman special, which people don’t want!
Geoff agreed that currently, couples are usually both employed and don’t have the time, expertise or inclination to start making repairs and remodels to the home they purchase. They would rather pay top dollar for a move-in-ready home. His advice for sellers: spend time renovating your home before putting in on the market. Bathrooms, kitchens, windows all need to be in good shape. Paint, new siding, fixing up the landscaping, and replacing the roof if necessary, will bring a good return on your investment. Buyers are willing to pay top dollar!
Next Market Update
Mark your calendars and join us on Tuesday, May 8 at 9:15 a.m. for our next Facebook Live Market Update. Our special guests will be Michael Giannetto of Residential Home Financing, who will be offering substantive updates on the mortgage market and Ken Ford of Warwick Valley Financial Advisors, who will discuss other economic factors impacting the housing market. If you can’t make it at 9:15, be sure to watch it later!
Agency News and Awards •
April 26, 2018
Meet Lucyann Tinnirello, the new Broker Manager of Green Team’s Warwick office.
Why a broker manager?
With his business expanding and taking most of his time, Geoff Green knew it was time to hand over the reigns of day-to-day management of the Green Team’s Warwick office to a new broker manager. Furthermore, he understood it would take someone special to do the job.
First of all, the perfect candidate would have to be experienced in real estate and able to handle the detailed management of the office. In addition, the candidate would have to be someone who was not ego driven. Finally, it would take someone able to work with a growing team of agents to solve problems and help them succeed in their businesses. Fortunately, the perfect candidate was already a member of the Green Team family.
Meet Lucyann Tinnirello, the perfect candidate…

Green Team Home Selling System is happy to welcome Lucyann Tinnirello as its first Broker Manager. With 34 years of experience, Lucyann knows the business inside and out. Thus, she understands that real estate is mostly about solving problems and developing relationships.
Lucyann sees the Broker Manager position as being an opportunity for caring, helping, resolving problems and promoting an atmosphere of teamwork, where agents share with their co-workers what their experiences have taught them. However, she also understands there will be challenges. In managing workflow, she knows she must practice neutrality, as well as empathy and efficiency. She feels well prepared to take on the responsibilities of this position, having been co-owner of her own firm. There is a motto that Lucyann lives by: “It’s nice to be important, but it’s more important to be nice.” Her fellow agents agree that Lucyann embodies this motto and is the person who can handle this job. She is both well liked and respected by her peers.
A message for Lucyann’s clients…
By the way, Geoff has a message for Lucyann’s clients. “Fear not! Lucyann will continue to list and sell homes! This position was designed for an active sales person, with support staff and systems providing back-up for the Broker Manager.”
One more word of wisdom…
Lucyann has one more bit of wisdom to live by. Football coach Lou Holtz said this at a seminar and she’s never forgotten it. “WIN…” or “What’s Important Now!” And for Lucyann, what’s important now is doing the best job she can as the Green Team’s new Broker Manager.


