

 Facebook
 X
X
 Pinterest
 Copy Link
How Does the Supply of Homes for Sale Impact Buyer Demand?

How Does the Supply of Homes for Sale Impact Buyer Demand?
The price of any item is determined by the supply of that item, as well as the market’s demand for it. The National Association of REALTORS (NAR) surveys “over 50,000 real estate practitioners about their expectations for home sales, prices and market conditions” for their monthly REALTORS Confidence Index.
Their latest edition sheds some light on the relationship between seller traffic (supply) and buyer traffic (demand).
Buyer Demand
The map below was created after asking the question: “How would you rate buyer traffic in your area?”
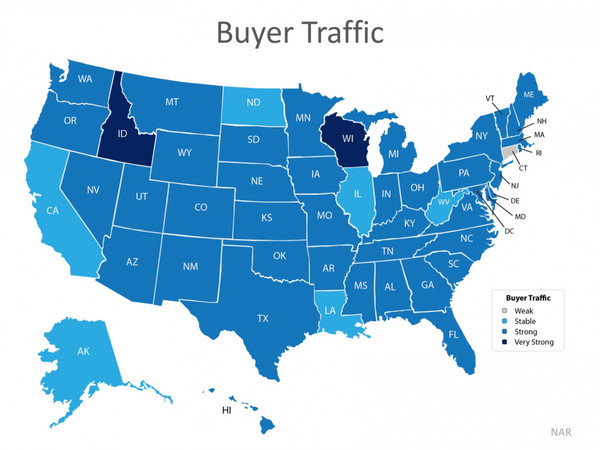
The darker the blue, the stronger the demand for homes is in that area. The survey showed that in 38 out of 50 states buyer demand was slightly lower than this time last year but remains strong. Only six states had a ‘stable’ demand level.
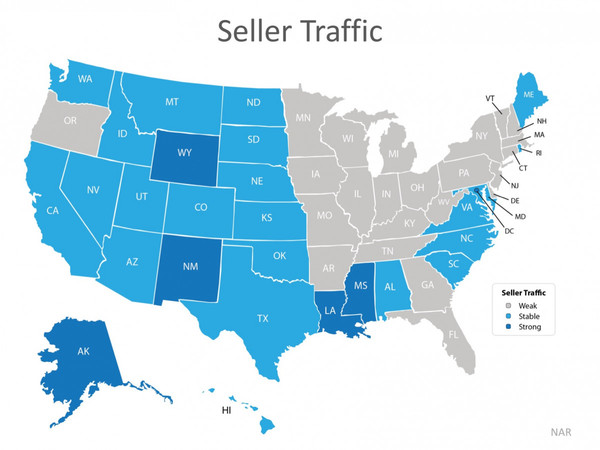
Seller Supply
The index also asked: “How would you rate seller traffic in your area?”
As you can see from the map below, 23 states reported ‘weak’ seller traffic, 22 states and Washington D.C. reported ‘stable’ seller traffic, and 5 states reported ‘strong’ seller traffic. This means there are far fewer homes on the market than what is needed to satisfy the buyers who are out looking for homes.
Bottom Line
Looking at the maps above, it is not hard to see why prices are appreciating in many areas of the country. Until the supply of homes for sale starts to meet buyer demand, prices will continue to increase. If you are debating listing your home for sale, let’s get together so I can help you capitalize on the demand in the market now!
Stay current with your local Housing Market New by signing up for our Housing Market Update Monthly Report.
November 2018 HOUSING MARKET UPDATE

The Green Team’s November 2018 Housing Market Update was held live on Facebook Tuesday, November 13 at 2 p.m. If you missed the live webinar, you can view it at your convenience by clicking here.
You can also sign up for future updates at GreenTeamHQ.com/hmu.
Meet this month’s Panelists…
Geoffrey Green , President/Broker of Green Team Home Selling System, moderates the monthly webinar and presents the national stats, as well as the market updates for Orange and Sussex Counties. This month he is joined by Pam Zachowski and Keren Goren of Green Team New Jersey Realty and Vikki Garby, Green Team Home Selling System, Warwick.


Joe Moschella, Branch Manager and Vice President of Lending, and Amy Green, Vice President of Lending, of Guaranteed Rate discuss market updates from a mortgage industry perspective.


The National Outlook
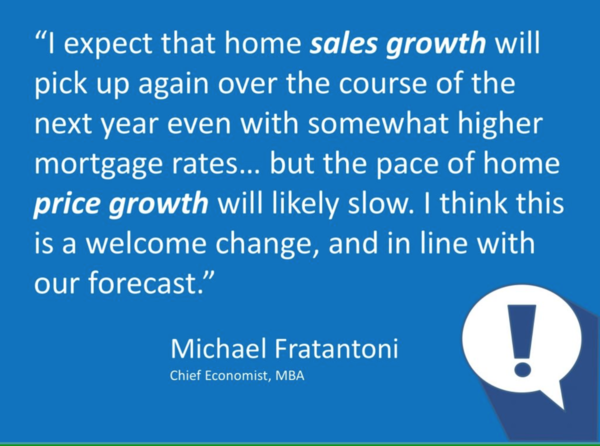
According to Geoff Green, it’s a very exciting time in the housing market right now as we’re starting to see some shifts. We’re experiencing all-time highs reminiscent of 2008 over the last 18 months. It does seem like things are cooling off. According to Michael Fratantoni, Chief Economist of the Mortgage Bankers Association, he expects that home sales growth will pick up again over the next year, even with somewhat higher mortgage rates, though the pace of price growth will likely slow.
Despite the fact that national and local numbers indicate that the velocity of homes selling is actually slowing, Fratantoni and some others are predicting that it is going to increase in 2018. So, it’s not that appreciation is going down, it’s just slowing down.
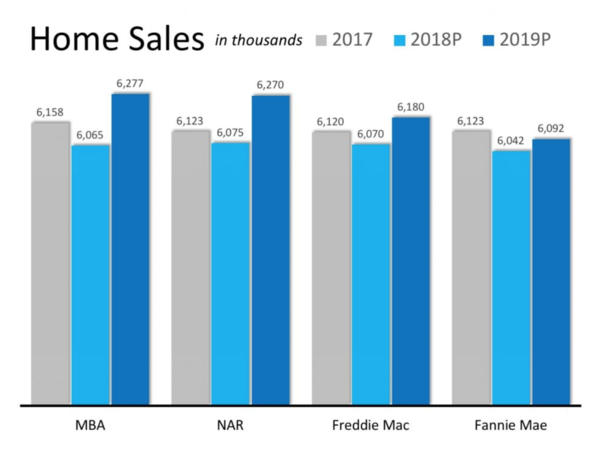
The Mortgage Bankers Association, National Association of Realtors, and Freddie Mac, with the exception of Fannie Mae, all are predicting increases over the past two years. All are predicting increases over the past year. For the most part each of these organizations wants the housing market to continue to grow. Geoff reminds us that it’s in their best interest. It’s important to be aware of the source of information. During the downturn In 2006, 2007 and 2008, during the downturn, some organizations were putting out information that did not accurately portray what was happening. However, you can rely on the Green Team to put out information that is accurate and honest.
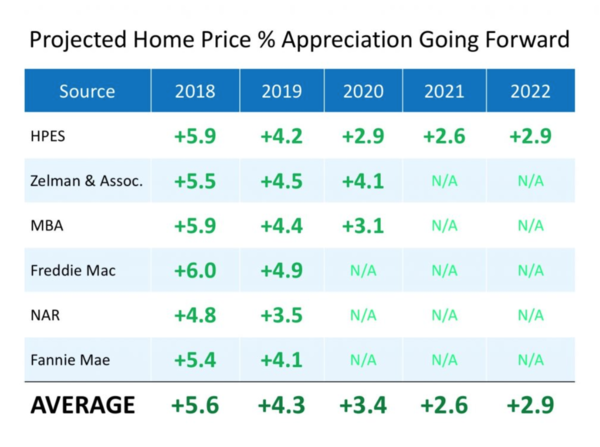
In projections for 2018 through 2022, everyone seems to have a positive outlook that the market will continue to appreciate. Just at a slower pace.
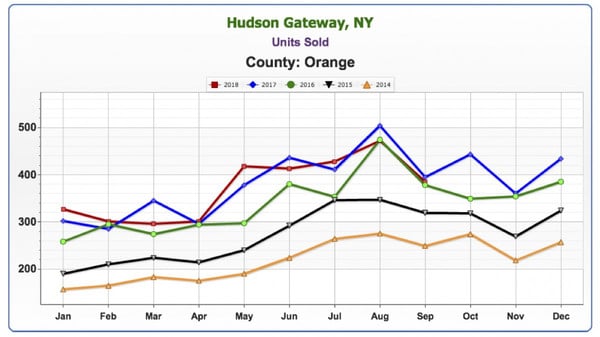
November 2018 Housing Market Update – Orange County
Units Sold
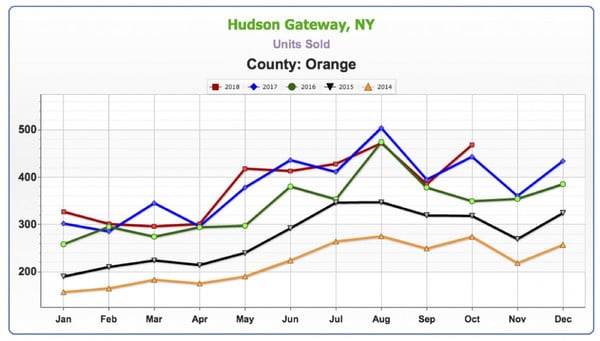
While this is hyper local, it is reflective of the 2018 national numbers. While prices may increase and decrease, depending on inventory, units sold have been a mixed bag this year versus last year. It’s been up, it’s been down.
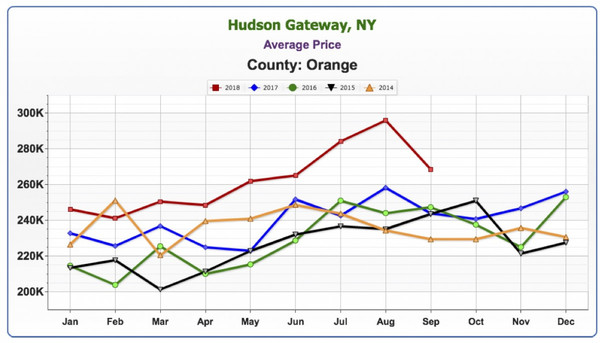
Average Price
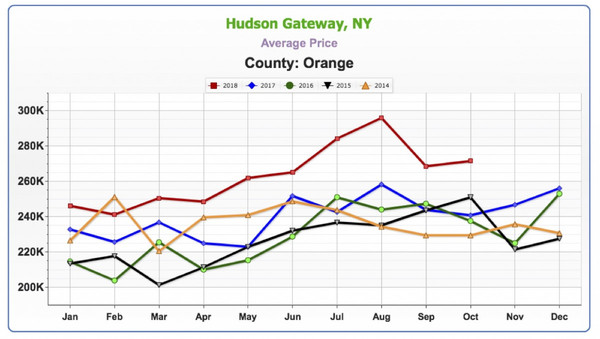
Geoff has found that price always lags activity, according to his observations over the past 14 years. If you start to see a slowdown in activity, 6 to 8 months later you’ll start to see a slowdown in the rate of price increases.
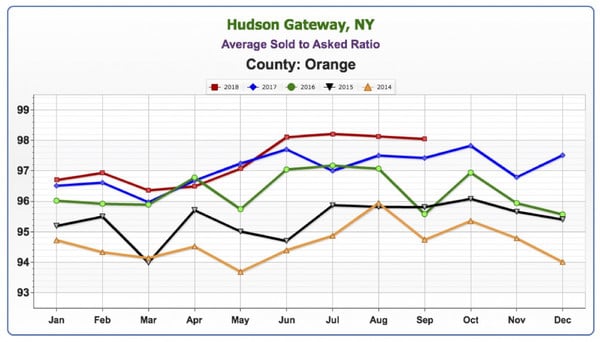
Sold to Asked Ratio
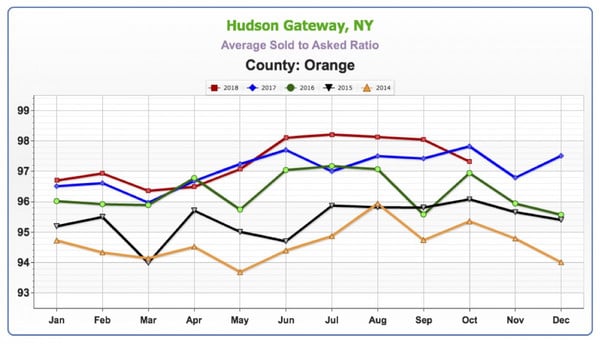
This is telling you at what percent of the asking price your home is selling for. The closer you are to 100%, the hotter the market. While this took a little dip recently, it is still at very high levels.
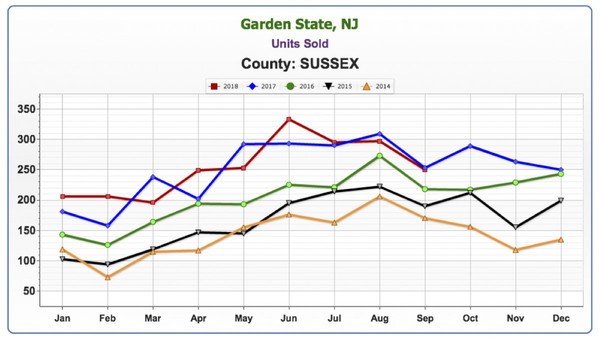
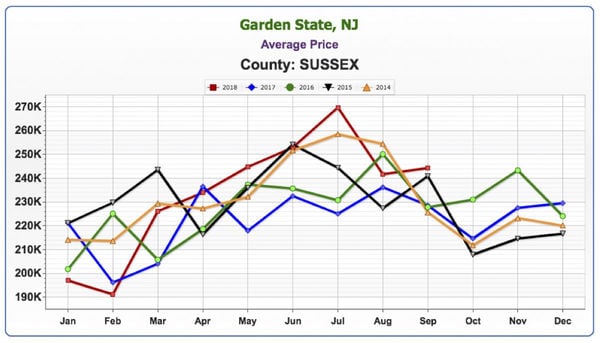
November 2018 Housing Market Update – Sussex County
Units Sold
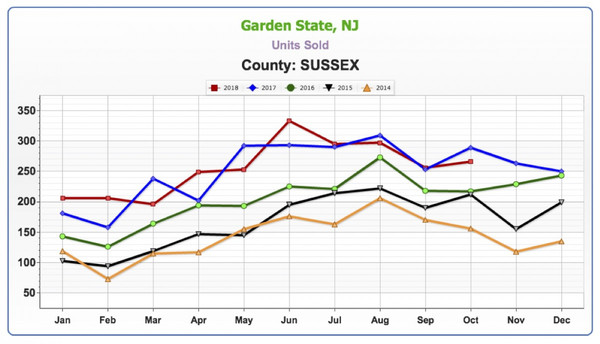
This is a small data sample that is still reflective of what is happening nationally. Again, it’s a mixed bag, up, down, then often flat.
Average Price
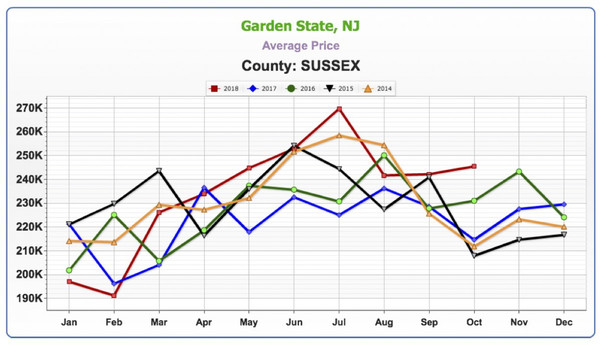
Average price never really gained a tremendous amount of traction, as compared to Orange County, where there had been increases in price.
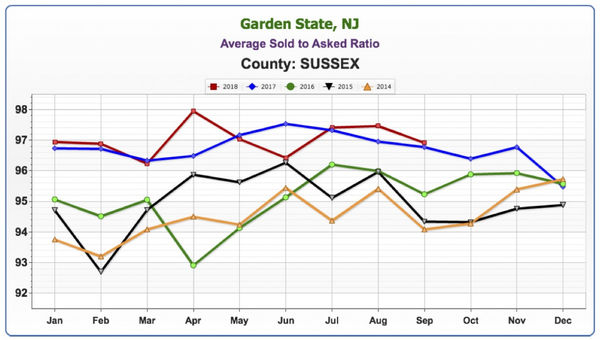
Sold to Asked Ratio
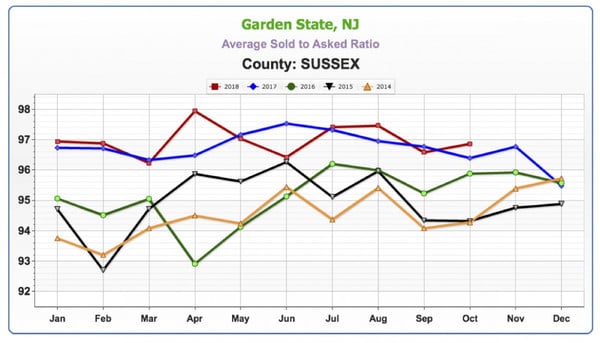
This looks similar to what is happening in Orange County.
Panel Discussion
The Sales Associates Points of View
Geoff asked Vikki what changes she’s seen since she was last on the panel about 4 months ago… Vikki agreed that she has been seeing a little bit of a slowdown, part of which she believes is due to timing. Many families time their house hunting to coincide with the start of school. However, what she’s finding is a lot of people are looking for land. Historically, we’ve had low inventory compared to the number of buyers, And, as existing house prices go up, more people are starting to consider new construction. Housing starts will be up 9% beginning of the coming year. So there is still a lack of inventory.
Pam also sees a slowdown. More people are looking for homes, but between the low inventory, the start of the school year, people are taking their time. She still sees investors trying to buy and flip homes but finding it harder and harder to find that good deal that makes it worthwhile.
Geoff then asked about appraisals. Are there issues with properties appraising, or are there now enough comps in the marketplace? Keren has not seen any problems recently. They’re all coming in at asking and a little bit above. One thing she has noticed is Sellers asking for CMA’s or listing presentations, more than she had over the summer. Keren always advises clients that we only know what the market is right now and can’t tell where it’s going. She lets them know that low inventory makes it a good time to put their home on the market, as opposed to waiting for Spring, Geoff replied that sellers that were holding off putting their home on the market may now decide to take a chance, seeing that the market is cooling off a little. This may ultimately bring more inventory and more transactions to the marketplace as a whole. There are still many buyers out there, anxious to find a home.
A Mortgage Industry Point of View
According to Joe Moschella, over the last 5 months they’ve seen a steady rise in interest rates. The year started with a 10-year treasury note at 2.21% and this week it was 3.21%, one full percent. That, along with the Fed stopping its purchasing of mortgage-backed securities, caused a liquidity crunch in the market. This contributed to pushing rates up. They started the year with 4% on a 30-year fixed rate and are now closing in on 5%.
Geoff asked Joe what the bond market was like 4 years ago on a percentage basis, just to give some perspective. Joe brings it back to 9/11, when the Fed didn’t want to see the economy spiral down. They jumped in and started dramatically dropping rates, bringing them down to almost zero. Now we’re seeing the unwinding of these artificially low rates. Thankfully the Fed eased into this, providing a “soft landing.” 2.21 to 3.2% represented about ¾ of a percent, interest rate wise. About 2, 2-1/2 years ago we were at 1.2% on the US Treasury. Before that, we were at the 0.7, 0.8% range. We’ve seen a steady rise, which hopefully the economy is strong enough to handle.
Some of the other changes in the market on the mortgage front are in the role technology is playing. Lenders are able to verify client’s income and assets automatically, do the application online and do the process without sending any paperwork back and forth. The whole process is done digitally.This is revolutionizing the industry and leading to higher consumer satisfaction. The industry is also easing credit standards. Geoff asked if easing credit standards was necessarily a good thing. Joe responded that rising rates have opened the door for new loan products to come out. Those new products are not coming from the banks, but rather from private equity firms flowing back into the market. No verification loans do not exist, but they have a bank statement loan that has come back into play. No seasoning waiting period for someone who had a foreclosure or bankruptcy or short sale, whereas before you had to wait three, four or seven years. Geoff stated that if you’re talking about private equity, they basically can do whatever they want with their money, as long as those products don’t make it into mortgage-backed securities. He asked if there were any controls in place to make sure that didn’t happen again. The trade-off with non-conforming products is that the buyer has to have some “skin in the game.” They need a sizeable down payment, and investors want higher return for higher risk, so rates may be at the 6-1/2% range.
Geoff said it’s important to keep things in perspective. The sky won’t be falling if rates hit 6-1/2%! Historically, it’s a pretty average rate.
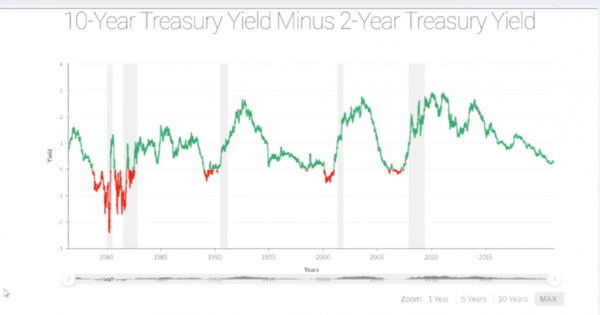
Joe and Amy had a graph showing 10-year treasury yield minus 2-year treasury yield. Historically when those yields come together, it signals a slowdown in the market or a recession. From Joe’s perspective, we might have a slow down in the stock market and see a pull back, but he’d rather see a market that goes up and goes down. In a stale market buyers and sellers are sitting on the fence; there is no call to action. As far as housing goes, everyone can do well and make some money.
Geoff thinks there is enough pent up demand from 2008 to 2016; there are a lot of people who need to buy a home and rates are still low enough. The American housing market is the place to be in the Global real estate market. There may be a continued cooling off and slow down a little. We’ve been at such high levels right now, it had to. Like the stock market, it can’t keep going up indefinitely; at some point it has to come down.
Thank you to our Sponsor,
REALLY – Agent to Agent Referrals
https://ReallyHQ.com
Please join us for the next Housing Market Update
December 11, 2018 at 2 p.m.
Stay informed. Sign up for our Housing Market Update at
October 2018 Housing Market Update

The Green Team’s October 2018 Housing Market Update was held live on Facebook Tuesday, October 16 at 2 p.m. If you missed the live webinar, you can view it at your convenience by clicking here.
You can also sign up for future updates at GreenTeamHQ.com/hmu
Meet this month’s Panelists from Green Team New Jersey Realty and Green Team Home Selling System
Geoffrey Green, President/Broker of Green Team Home Selling System, is the moderator of the monthly webinar and presents stats and market updates for Orange and Sussex County. He is joined this month by Keren Gonen, Pamela Zachowski and Alison Miller of Green Team New Jersey Realty in Vernon and Jacqueline Kraszewski of Green Team Home Selling System in Warwick.


Market Update – The National Perspective
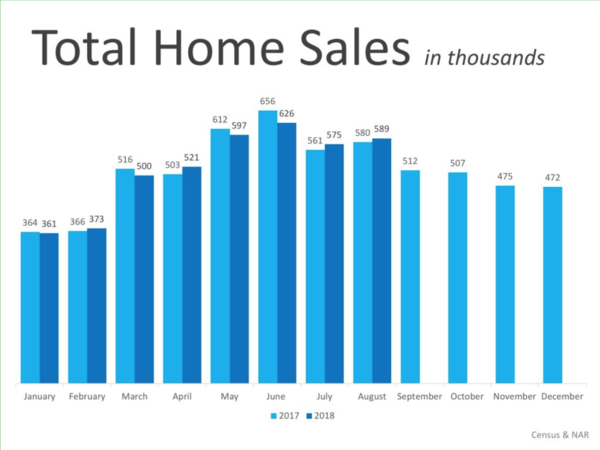
A look at Total Home Sales Nationally
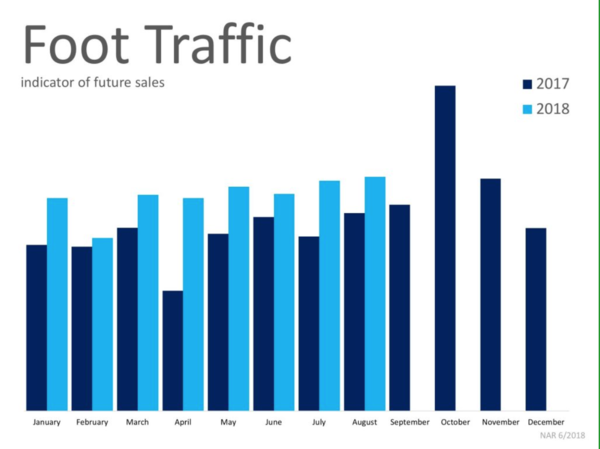
Things seem to be shifting in the housing market. For Geoff, the stats of homes sold are the “mother’s milk” of the industry. Nationally it’s been a mixed bag through 2018. September’s numbers are not yet in, but August numbers for total home sales were just about even for 2017 and 2018. It appears that things are shifting in the market, with the number of sales not increasing like last year, year over year. However, foot traffic in August was much higher in 2018 than in the same period in 2017.
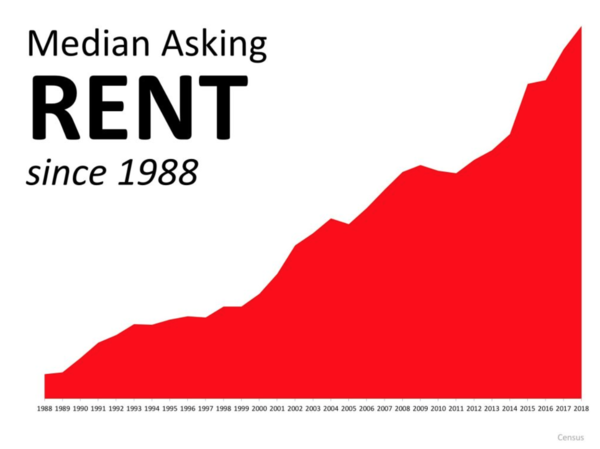
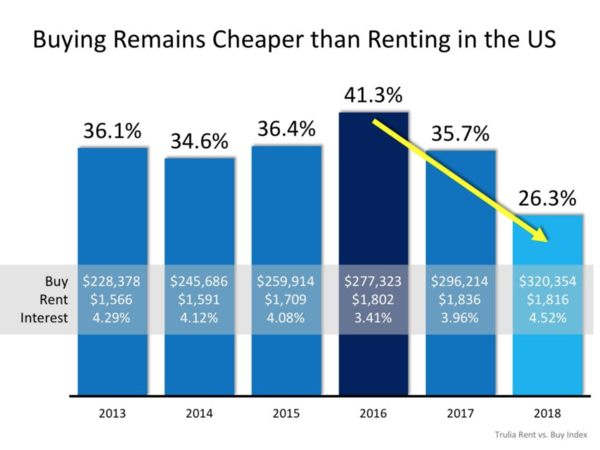
Buying versus Renting…Which is the best way to go?
Lawrence Yun, the economist of NAR, has said that we’ll probably see growth in terms of the housing market on the lower end because the job market is strong. People are working, making money and want to invest their money in real estate. However, there may be a slowdown in the higher end because interest rates are rising. How does affordability of renting compare with buying? There is a steep curve, not a good outlook for renters. Since 2013 it has been cheaper to buy instead of rent on an overall national basis. If you have the ability, it costs less to buy than to rent on an overall monthly basis.
October 2018 Housing Market Update – Orange County
Units Sold
As stated before, Geoff sees this number as the mother’s milk of the housing market. This all-important number gives us a snapshot of how many homes are selling. The number of units sold in Orange County appears to be cooling off. He believes we’ve seen the peak of the last runoff and that it’s behind us. Geoff’s view seems to be backed up by an article that appeared last week in the Wall Street Journal, which referred to a soft downturn in the market.
Average Price
There is a big variance in price from where we were last year. The downward trend is a seasonal fluctuation and not a cause for concern. Price always lags units sold at least 6 months or more. Price increases may occur over the next 6 to 12 months, even though the number of units sold is dropping.
Average Sold to Asked Ratio
We are still pretty high, still over 98%, which means sellers are only having to negotiate 2% from their asking price.
October 2018 Housing Market Update – Sussex County
Units Sold
A similar trend to Orange County, where some months are up, some down, on a year over year basis. It’s a mixed bag, and the numbers seem to indicate a cooling off.
Average Price
Average prices never rocketed in Sussex as they did in Orange County. In previous updates, we’ve spoken about how there is simply more foreclosure inventory and activity which has dragged down the average. However, that doesn’t mean that homes that are well maintained and well located haven’t done well.
Average Sold to Asked Ratio
Average price never rocketed here like it did in Orange County. There has been much more foreclosure inventory and activity in Sussex and that has dragged down the average home price. However, that doesn’t mean that well-located, well-maintained homes haven’t done well.
Slightly below Orange County, the numbers are still hovering around 98%.
Panel Discussion
The Sales Associates Point of View
Geoff believes the market is cooling. He asked the panelists what they were sensing in the field. Keren replied that there are fewer houses that are updated and nicely done, and buyers have higher expectations. During the summer, people were rushing to find homes in order to get situated before the start of the school year. Without that added stress, many buyers are being pickier. Alison finds that people are looking for something that is just not there. Inventory is not meeting the demand. In addition, many of her closings were delayed, affecting numbers for September.
Jacque is finding that there is a lack of finished, move-in-ready homes under the $400,000 price point in Warwick. In addition, many families with school-aged children are waiting for the spring to resume their search. Also, the seasonal fluctuation impacts the market as people are beginning their holiday preparations. Pam is also seeing the issues mentioned by the other sales associates. The inventory shortage, buyers being very picky, even homes that have been flipped that aren’t good enough. It’s difficult for people to find what they’re looking for in their dollar amount.
Geoff summed up these comments by stating it is still a very good time to sell a house. However, there is nothing to stop the housing market from slowing down. Thus he advises sellers not to put off listing their home if they are planning on selling.
Guest Panelist, Matt Zagroda, discusses the bond market…
 Matt Zagroda is a Sales Manager at MBS Highway, the leading provider of real-time market data for mortgage professionals. As such, Geoff welcomed his input on the bond market. Geoff asked Matt what is happening with the bond market, as rates seem to be increasing by the minute. Matt explained that at the end of last year the Fed wanted to do quantitative tightening. Previously they had been reinvesting gains from the bond market back into the bond market, which brought their balance sheet up greatly.
They wanted to wind that balance sheet down and made a plan just before Janet Yellen stepped down as Fed Chair. So, October of last year they wanted to reduce it by $10 billion. January of this year, $20 billion, April $30 billion, July $40 billion and October, $50 billion. That was the last tightening session. They weren’t going to continue to reinvest it. There is no Fed buying into the bond market, which is why we’re seeing changes in interest rates. There was a drop in the bond market and a rise in rates.
Matt expects that in the upcoming months we’ll be experiencing volatility. However, this is actually a more normal bond market. If there is any economic news that would potentially hurt bonds, we’ll notice it more. Previously the Fed was buying back into it, softening the blow, creating almost a safety net. Now there is no safety net, so if it’s going to hurt – it’s going to hurt. That doesn’t mean that if there’s good news that it will be the opposite and that it will help the bond market… Again, the Fed is not juicing the good news to buy and make that increase even more so.
More volatility is expected into the future, potentially more to the downside, but it’s not expected to be a straight downward line. Rates may continue to get worse, though the hope is that they’ll remain steady. Much depends on what happens with the Fed and their plans for rate hikes.
Geoff recalled buying his first home around 2003. His 30 year fixed rate was at 6.5%. We’re hovering now at about 5% now. Matt agreed that was about right.
Looking back, it hasn’t been higher than this since 2009. Previously, it was much higher. Rates have been pretty much below 5% since then. The largest run on the housing market was 2005, 06, 07 and rates were pretty high back then. The rates may impact the mortgage industry insofar as refinancing. However, when rates eventually come down, the refinancing market should open up again.
… the stock market, and global contagion
Geoff asked Matt his thoughts on the stock market and its unbelievable run. Matt expects that eventually we can’t go much higher and things will come back to a more normal range. Not a crash, but just a more normal range that will help bonds and interest rates even a little bit. When money comes out of stocks it is generally invested in bonds, especially when there’s talk of trade wars, etc. When there is uncertainty in the market, many people invest in safer, long-term investments like bonds.
Geoff had a final question… The idea that there could be a global contagion. By and large, there is a lot of risk around the globe. Many governments are not in a good fiscal situation. Currencies are all over the place. There’s a lot of risk around the globe. The US seems like the shining city on the hill, on our own pedestal for some time. He asked Matt his thoughts on the global market. Matt replied that there is turmoil in Europe, and especially Italy right now. The world is interconnected. However, we’re not expecting great leaps and bounds right now because of that turmoil. However, it does affect us.
In closing, Geoff recommends the article he mentioned at the beginning of the update. Written by Laura Kusisto, it was published in the Wall Street Journal on October 13. “Housing Market Positioned for a Gentler Slowdown Than in 2007″ provides a good, historical outlook on the market and its future.
How Much Has Your Home Increased in Value?

Home values have risen dramatically over the last twelve months. In CoreLogic’s most recent Home Price Index Report, they revealed that national home prices have increased by 6.2% year-over-year.
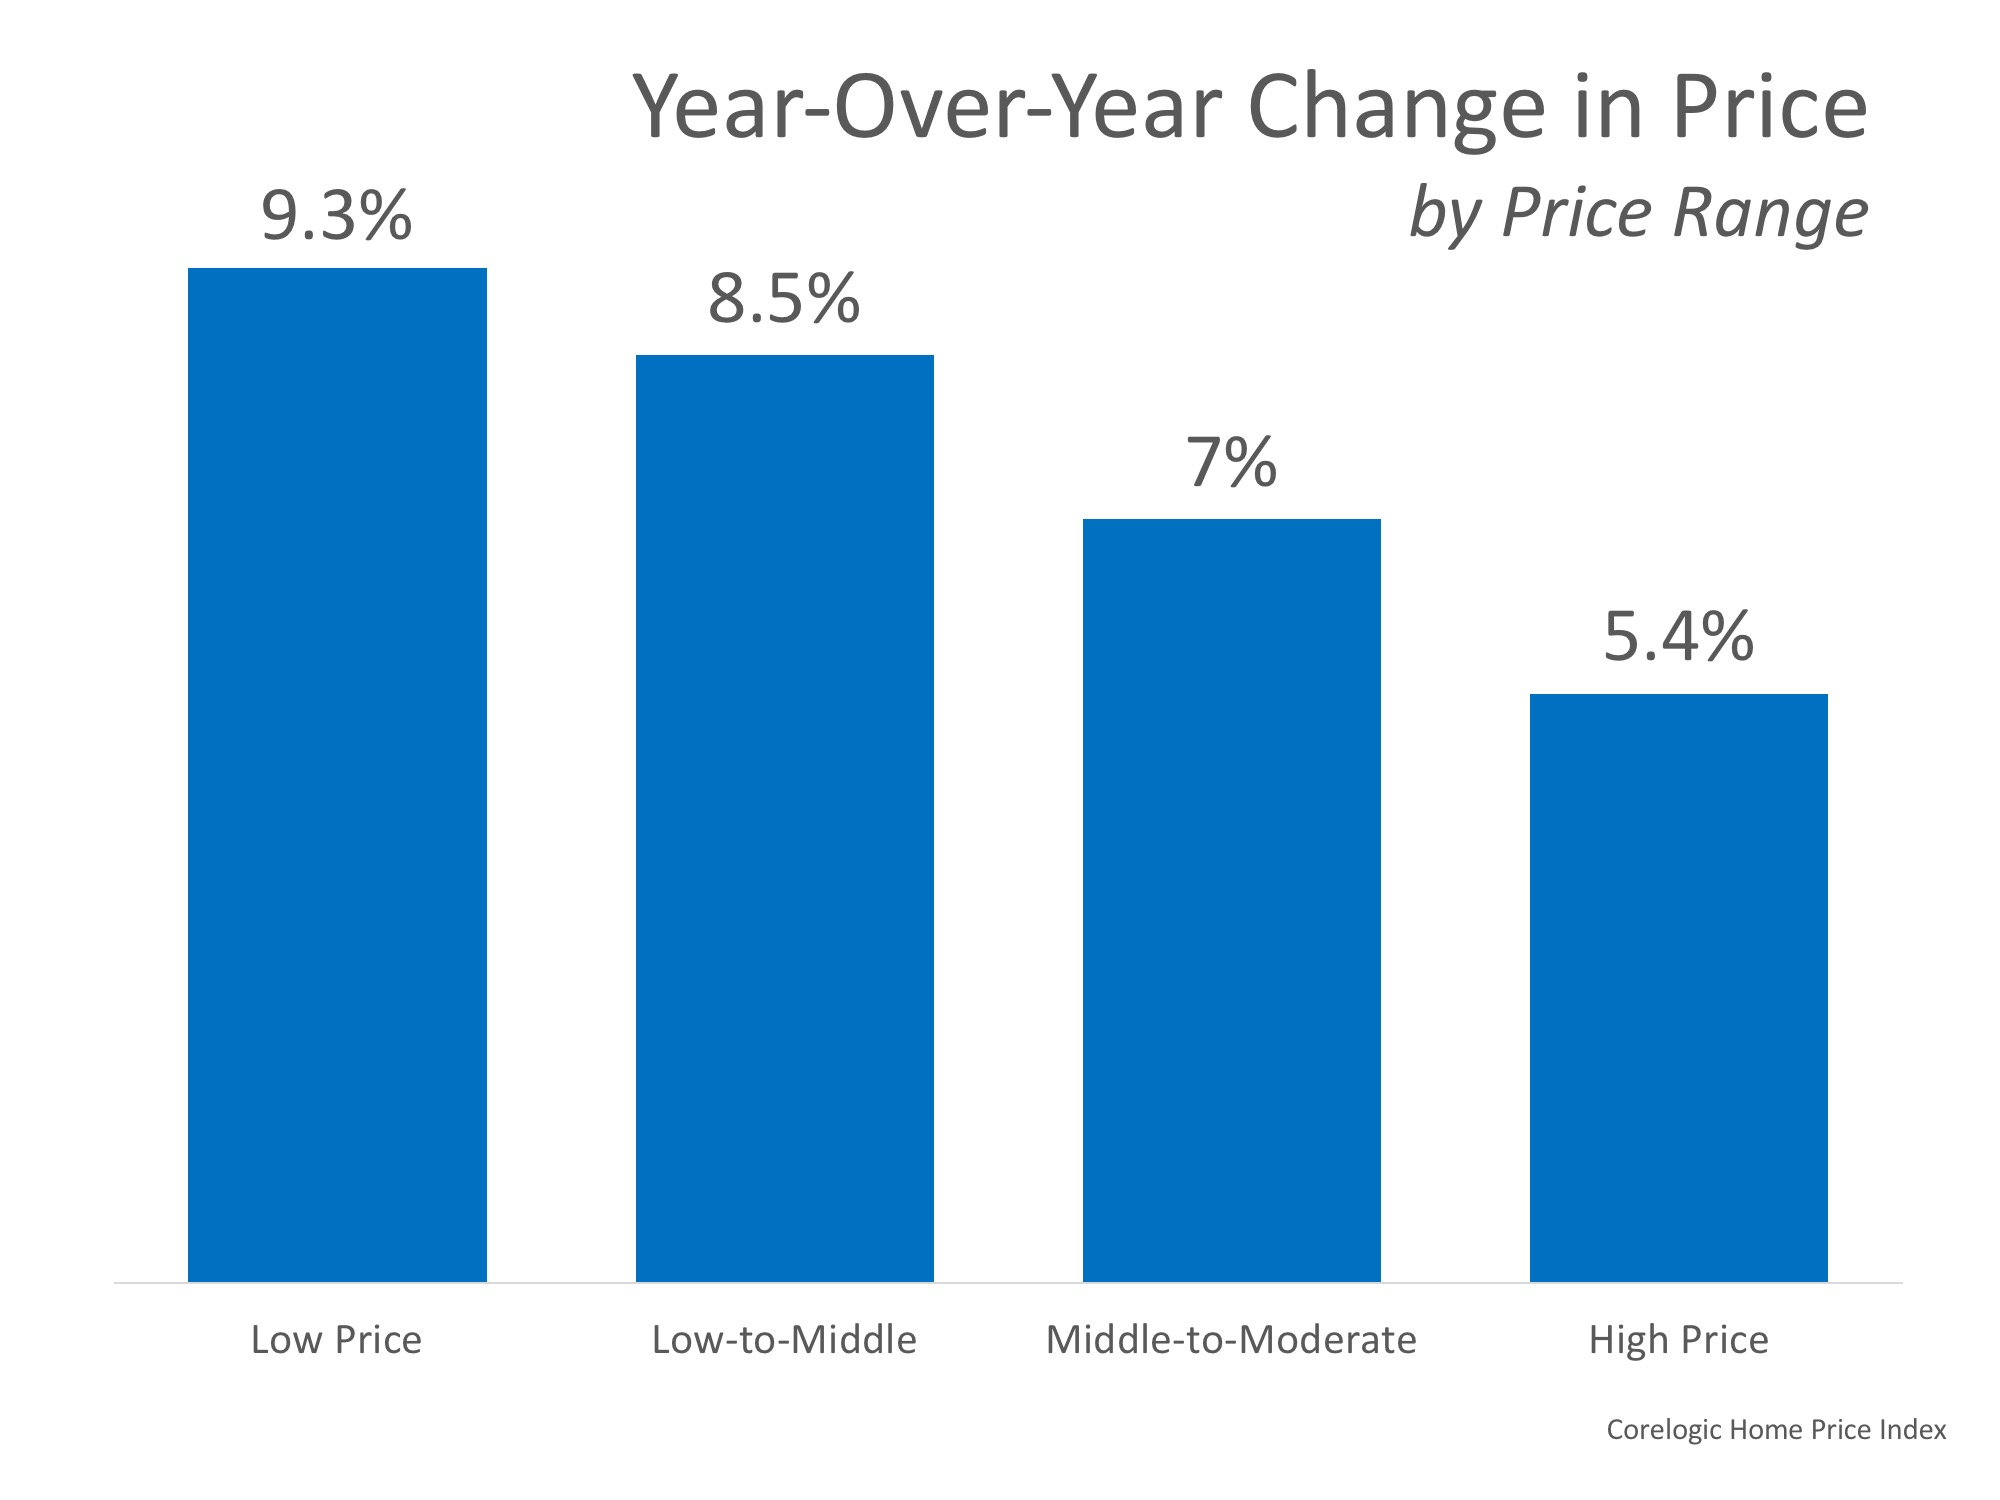
CoreLogic broke down appreciation even further into four price ranges, giving us a more detailed view than if we had simply looked at the year-over-year increases in national median home price.
The chart below shows the four price ranges from the report, as well as each one’s year-over-year growth from July 2017 to July 2018 (the latest data available).

It is important to pay attention to how prices are changing in your local market. The location of your home is not the only factor which determines how much your home has appreciated over the course of the last year.
Lower-priced homes have appreciated at greater rates than homes at the upper ends of the spectrum due to demand from first-time home buyers and baby boomers looking to downsize.
Bottom Line
If you are planning to list your home for sale in today’s market, let’s get together to go over exactly what’s going on in your area and your price range. Find out what your home’s value is today – click here.
Green Team New Jersey Realty celebrates the opening of their new office building.
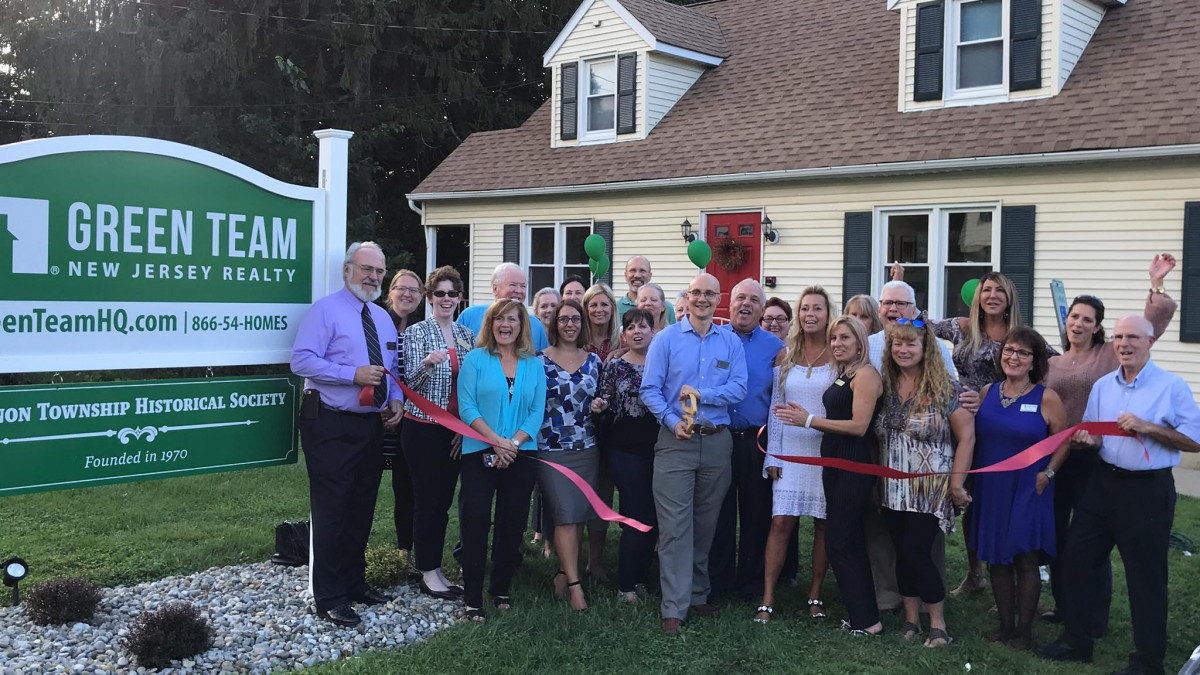
Green Team New Jersey Realty celebrates the opening of their new office building
Just two years and five days after the ribbon cutting that launched the opening of the Green Team’s Vernon office, a new ribbon cutting was held. On Thursday, September 13, Green Team New Jersey Realty (“GTNJR”) celebrated the official opening of its new office building at 293 South Route 94, Vernon, New Jersey. And the ample parking lot was perfect for the celebration that followed.

A little history…
The Green Team Home Selling System, founded in 2005, is in the top ten of all brokerages in Orange County, New York. When Geoffrey Green was approached by agents wanting to open an office in Vernon, New Jersey, it made perfect sense. Vernon was an underserved market, just across the border from Warwick, New York where the Green Team is based. However, even Geoff and equity partners Kim Lasalandra, Charles Nagy and Ted VanLaar couldn’t foresee the rapid growth of Green Team New Jersey Realty. For Charles, real estate has always been about people and making relationships. It’s what he truly loves about the business. However, his long term plans included retirement and relaxation. Now Green Team New Jersey Realty and its rapid success has put all talks of retirement on hold. There are new people to meet, new relationships to forge, and an exciting business to grow.
Utilizing the systems developed by Geoff Green, the Vernon office flourished. At six months there were 8 sales associates. That number kept growing as agents learned about the Green Team’s core values, its unique training and mentoring programs, and its commitment to providing the best possible client service.
In 2017, six GTNJR sales associates were recognized by the New Jersey Association of Realtors for achievement and excellence in sales. Considered among the most prestigious honors awarded to Realtors in the Garden State, the NJAR Circle of Excellence recognizes members who have excelled in the field of salesmanship. Ann Nussberger achieved the Silver Level ($6.5 million and 20 units minimum or 70 units). Recipients of the Bronze award ($2.5 million and 15 units minimum or 30 units) were Barbara Tesa, Joyce Rogers, Charles Nagy, Keren Gonen and Theodore Van Laar.
The future looks great…
As Geoff Green so eloquently put it, “Even though we’re here to celebrate the grand opening of the new building, it’s really a celebration of the people of the Green Team.” In less than two years, Green Team New Jersey Realty has become one of the top 20 real estate agencies in all of Sussex County and is one of the top five in Vernon. Thus, with 18 Sales Associates and a new home, the sky’s the limit. Yes, the Green Team has good reason to celebrate.
Homeowners & Appraisers See the Most Eye-to-Eye on Price in 3 Years


In today’s housing market, where supply is very low and demand is very high, home values are increasing rapidly. Many experts are projecting that home values could appreciate by another 5% (or more) over the next twelve months. One major challenge in such a market is the bank appraisal.
When prices are surging, it is difficult for appraisers to find adequate, comparable sales (similar houses in the same neighborhood that recently closed) to defend the selling price when performing the appraisal for the bank.
Every month in their Home Price Perception Index (HPPI), Quicken Loans measures the disparity between what a homeowner who is seeking to refinance their home believes their house is worth and what an appraiser’s evaluation of that same home is.
March 2015 marked the first month of a three-year gap between what an appraiser and a homeowner believed a home was worth. That gap widened to 2.65% in September 2015 and had consistently hovered between 1.0% and 2.0% through November 2017.
The chart below illustrates the changes in home price estimates over the last three years:
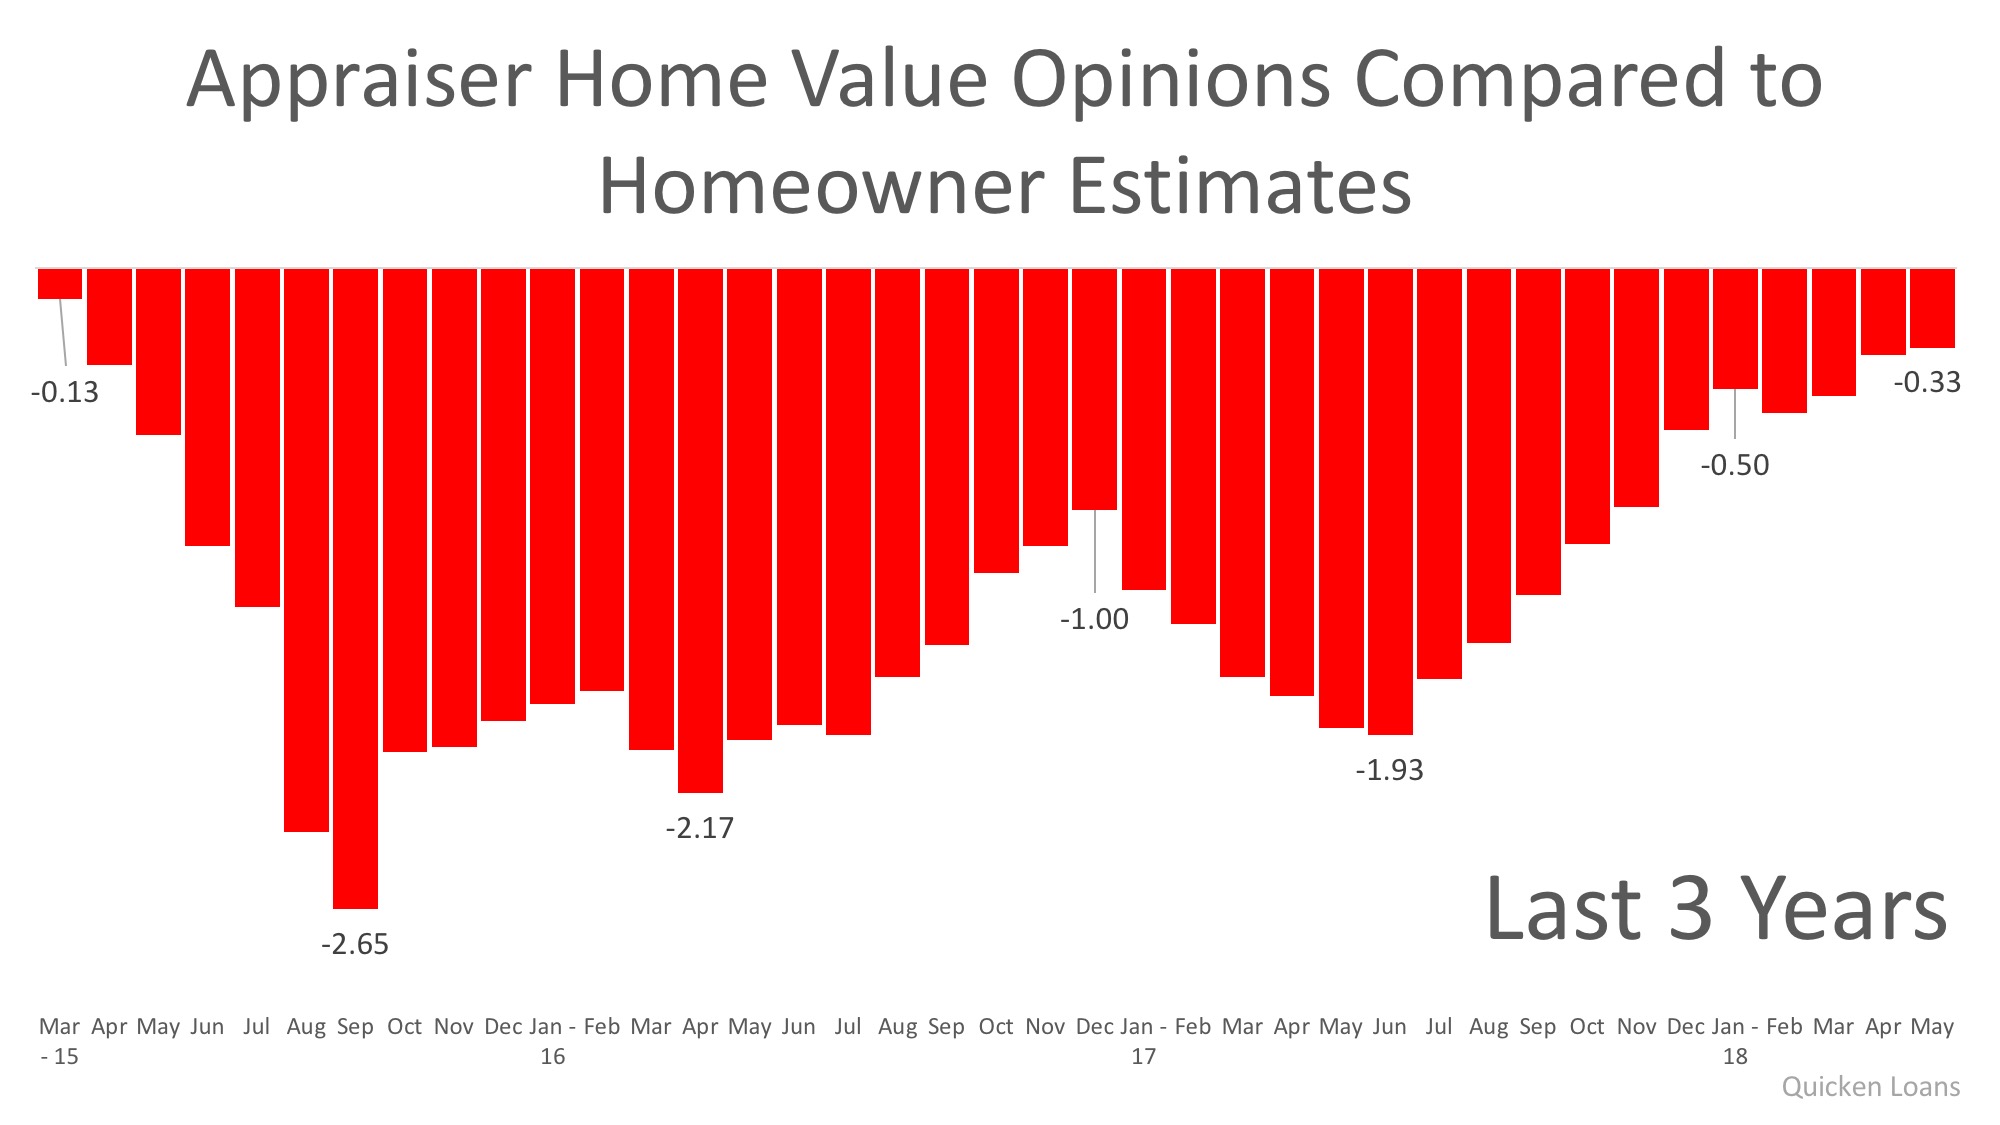
In the latest release, the disparity was the narrowest it has been since March 2015, as the gap between appraisers and homeowners was only -0.33%. This is important for homeowners to note as even a .33% difference in appraisal could equate to thousands of dollars that a buyer or seller has to come up with at closing (depending on the price of the home).
Bill Banfield, Executive VP of Capital Markets at Quicken Loans urges homeowners to find out how their local markets have been impacted by supply and demand:
“The appraisal is one of the most important, although sometimes least predictable, parts of the mortgage process. The Home Price Perception Index is a way to illustrate the differences of opinion, and these differences affect everything from the type of mortgage a borrower can get to the expectations a seller has about the proceeds available upon sale of their home.”
Bottom Line
Every house on the market must be sold twice; once to a prospective buyer and then again to the bank (through the bank’s appraisal). With escalating prices, the second sale may be even more difficult than the first. If you are planning on entering the housing market this year, let’s get together to discuss this and any other obstacles that may arise.
What’s Your Home’s Value? – Click Here
Did Tax Reform Kill the Luxury Market? NOT SO FAR!


The new tax code limits the deduction of state and local property taxes, as well as income or sales taxes, to a total of $10,000. When the tax reform legislation was put into law at the beginning of the year, some experts felt that it could have a negative impact on the luxury housing market.
Capital Economics:
“The impact on expensive homes could be detrimental, with a limit on the MID raising taxes for those that itemize.”
Mark Zandi of Moody’s Analytics:
“The impact on house prices is much greater for higher-priced homes, especially in parts of the country where incomes are higher and there are thus a disproportionate number of itemizers, and where homeowners have big mortgages and property tax bills.”
The National Association of Realtors (NAR) predicted price declines in “high cost, higher tax areas” because of the tax changes. They forecasted a depreciation of 6.2% in New Jersey and 4.8% in Washington D.C. and New York.
What has actually happened?
Here are a few metrics to consider before we write-off the luxury market:
1. According to NAR’s latest Existing Home Sales Report, here is the percent change in sales from last year:
- Homes sales between $500,000 – $750,000 are up 11.9%
- Homes sales between $750,000 – $1M are up 16.8%
- Homes sales over $1,000,000 are up 26.7%
2. In a report from Trulia, it was revealed that searches for “premium” homes as a percentage of all searches increased from 38.4% in the fourth quarter of 2017 to 41.4% in the first quarter of 2018.
3. According to an article from Bloomberg:
“Median home values nationally rose 8 percent in March compared with a year earlier, while neighborhoods of San Francisco and San Jose, California, have increased more than 25 percent.
Prices in affluent areas in Delaware and New York, such as the Hamptons, also surged more than 20 percent.”
Bottom Line
Aaron Terrazas, Zillow’s Senior Economist, probably summed up real estate’s luxury market the best:
“We are seeing the opposite of what was expected. We have certainly not seen the doomsday predictions play out.”
Want to learn more about how the new Tax Code will affect your local housing market – Register for our Housing Market Update on, Tuesday June 12 at 9am.
Moving Up to Your Dream Home? Don’t Wait!


Mortgage interest rates have risen by more than half of a point since the beginning of the year, and many assume that if mortgage rates rise, home values will fall. History, however, has shown this not to be true.
Where are home values today compared to the beginning of the year?
While rates have been rising, so have home values. Here are the most recent monthly price increases reported in the Home Price Insights Report from CoreLogic:
- January: Prices were up 0.5% over the month before.
- February: Prices were up 1% over the month before.
- March: Prices were up 1.4% over the month before.
Not only did prices continue to appreciate, the level of appreciation accelerated over the first quarter. CoreLogic believes that home prices will increase by 5.2% over the next twelve months.
How can prices rise while mortgage rates increase?
Freddie Mac explained in a recent Insight Report:
“In the current housing market, the driving force behind the increase in prices is a low supply of both new and existing homes combined with historically low rates. As mortgage rates increase, the demand for home purchases will likely remain strong relative to the constrained supply and continue to put upward pressure on home prices.”
Bottom Line
If you are thinking about moving up to your dream home, waiting until later this year and hoping for prices to fall may not be a good strategy.
How Much Has Your Home Increased in Value Over the Last Year?


Home values have risen dramatically over the last twelve months. In CoreLogic’s most recent Home Price Index Report, they revealed that national home prices have increased by 6.7% year-over-year.
CoreLogic broke down appreciation even further into four price ranges, giving us a more detailed view than if we had simply looked at the year-over-year increases in national median home price.
The chart below shows the four price ranges from the report, as well as each one’s year-over-year growth from February 2017 to February 2018 (the latest data available).
It is important to pay attention to how prices are changing in your local market. The location of your home is not the only factor that determines how much your home has appreciated over the course of the last year.
Lower-priced homes have appreciated at greater rates than homes at the upper ends of the spectrum due to demand from first-time home buyers and baby boomers looking to downsize.
Bottom Line
If you are planning to list your home for sale in today’s market, let’s get together to go over exactly what’s going on in your area and your price range or start by getting your free home value estimate today. It’s quick and free – Click Here
Sussex County Real Estate Market Report for April 2018
Green Team Business Review – April 2018
There has been a lot of excitement at the Green Team lately. Much of it was generated by the Launch Competition, which was a tremendous success this year. You can read about this annual contest, its goals, the winners, and the prizes here. In addition, Joyce Rogers was named the recipient of the First Quarter Sales Leader Award for the Vernon office.
Making Market Updates More Informative and More Accessible
While it seems that would be enough to report, there’s more. The Green Team strives to bring its agents and its clients up-to-date market information as well as insights into the mortgage market, events that impact interest rates, and more. To provide all this information in an expanded, far-reaching format, the Green Team is going Live on Facebook!
Sussex County, NJ Real Estate Market Report – March 2018 Results
We are pleased to share with you the Housing Market Report for March 2018. We break down local real estate activities and provide you with stats, graphs, and analysis of our local and regional real estate markets. The April Market Update was held Tuesday, April 17 on Facebook Live. It was moderated by Geoff Green, the Broker/Manager of Green Team Home Selling System. Panelists included sales agents Barbara Tesa and Keren Gonen. In addition, Jeremy Miller of First Home Bank provided insights on mortgage and housing industry stats. Dan Habib, of MBS Highway, a firm that provides insight and analytics to industries, discussed where interest rates are headed and the topic of affordability. Watch the video on our Facebook page to hear what these experts had to share.
Also, you can sign up on the Green Team website to receive monthly updates by email.
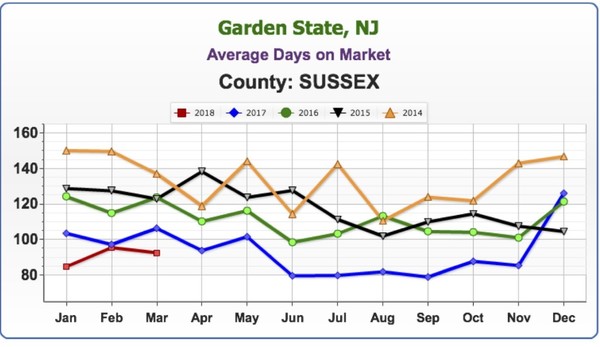
Average Days on the Market
The faster homes are selling, the hotter the market. Look for the lowest number on the graph, as opposed to the highest.
We take a snapshot of the past 5 years and see how the current market compares. The average number of days on the market is the lowest it’s been for March since 2014, coming in at 92.51 days. This is great news for sellers, but not such good news for buyers.
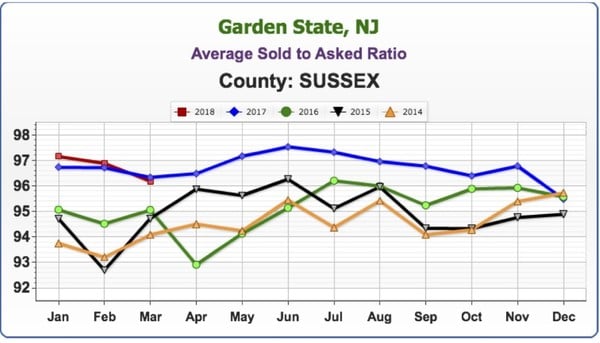
Average Sold to Asked Ratio
The percentage a house sold for under or over the last asking price (not the original price).
The Average Sold to Asked Ratio has been closely tracking 2017 numbers and is above the prior three years.
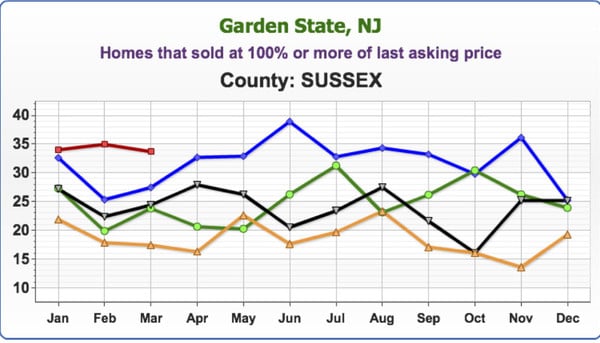
Homes that sold at 100% or more of last asking price
The first 3 months of 2018 have consistently been higher than the previous four years. In March almost 35 percent of homes sold at 100% or more of their last asking price..
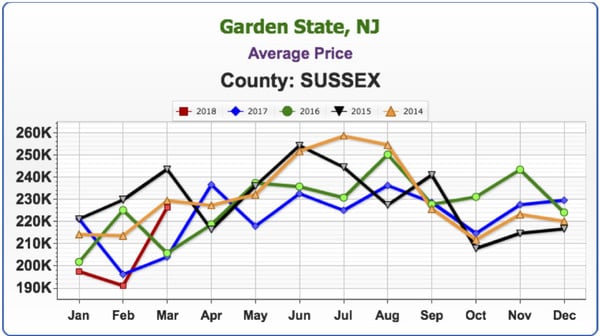
Average Price
There have been some interesting stats on average price. February 2018 was the lowest month in 5 years, but the March numbers are climbing up, higher than March 2016 and 2017, closing in on 2014, and and trying to close the gap with 2015’s numbers.
Barbara stated that so many homes are at or below the $200,000 mark that they’re dragging down the County average. There are also foreclosures below $100,000 that need so much work they’re just tear downs. Add the underwater inventory, short sales or foreclosures into the mix and that further brings down the average. According to Keren, banks are getting smarter, spending $20,000 to paint, put in new kitchen, flooring, or trying to make a house a little more acceptable. However, more often than not, the house is not in good enough condition for new buyers.. Buyers are willing to pay more, but don’t want to pay more when they see mold, etc. Banks are putting houses up at prices too high for flippers to purchase, flip and make a profit on. When a foreclosure does come up that is in good condition, intense bidding wars ensue.
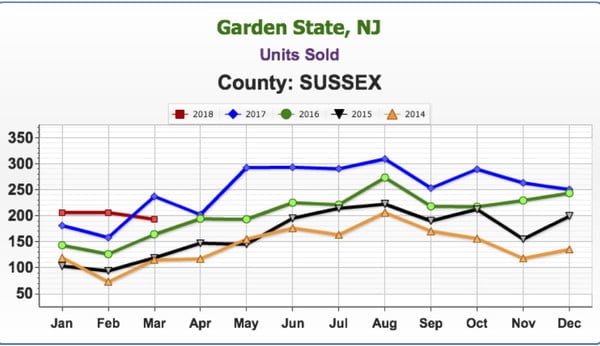
Units Sold
March dipped below the number of units sold in 2017, though it remained higher than the previous three years.
Keren stated that the banks have been holding on to inventory, waiting to release foreclosures in the spring market for a higher return on their investment. They’re thinking things are bad right now, so let’s just hold on and wait for the spring market. Keren Goren has experience in real estate investment, flipping homes, etc., so she brings a valuable perspective to the conversation.
Next Market Update
Mark your calendars and join us on Tuesday, May 8 at 9:15 a.m. for our next Facebook Live Market Update. Our special guests will be Michael Giannetto of Residential Home Financing, who will be offering substantive updates on the mortgage market and Ken Ford of Warwick Valley Financial Advisors, who will discuss other economic factors impacting the housing market. If you can’t make it at 9:15, be sure to watch the video later!


