

 Facebook
 X
X
 Pinterest
 Copy Link
Celebrating Vanessa Wight’s Success in 2024 Q3 for BHGRE Green Team’s Goshen Office
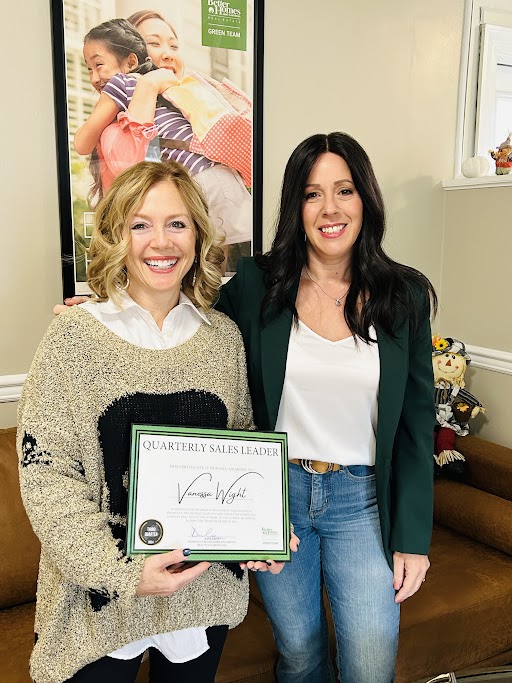
We are thrilled to recognize Vanessa Wight for her outstanding performance during the third quarter of 2024 at Better Homes and Gardens Real Estate Green Team’s Goshen office. Vanessa’s tireless dedication, passion for real estate, and exceptional client service have continued to make her a standout agent, helping her achieve impressive results this quarter.
Putting Clients First, Always
Vanessa has built a reputation for consistently putting her clients’ needs first and crafting tailored strategies that align with their unique goals. Whether helping a first-time homebuyer navigate the process or assisting a seller in maximizing the value of their home, Vanessa goes above and beyond to ensure success.
Her clients frequently praise her approachable and attentive nature, highlighting how she makes them feel supported and informed throughout every step of their real estate journey. With Vanessa, it’s more than just a transaction—it’s about building strong, lasting relationships.
Expertise That Makes a Difference
As an experienced agent deeply embedded in the local community, Vanessa brings invaluable expertise to the table. She knows the ins and outs of the local real estate market, from the unique characteristics of each neighborhood to current pricing trends and market conditions.
Vanessa’s ability to leverage this knowledge, combined with her sharp negotiation skills, has made her a trusted advisor for buyers and sellers. Whether you’re looking for your dream home or trying to sell for top dollar, Vanessa’s insight and market expertise are indispensable.
A Role Model Within the Team
In addition to her impressive accomplishments with clients, Vanessa has become a beacon of positivity and collaboration in the Goshen office. Her enthusiasm, willingness to support her fellow agents, and natural leadership abilities contribute greatly to the office’s vibrant culture. She is always available to share her experiences, offer guidance, and provide encouragement, fostering a collaborative environment that benefits everyone.
Vanessa’s presence elevates the entire team, making her a trusted real estate professional and a valued colleague.
Success Built on Consistency
Vanessa’s success this quarter is just the latest in a series of achievements that showcase her consistency and drive. In July 2024, Vanessa celebrated her first million-dollar sales month, quickly surpassing $1 million in sales volume. Her momentum continued into August when she reached the commission Cap, demonstrating her ability to achieve outstanding results while delivering top-notch service.
Her dedication, professionalism, and commitment to excellence have helped Vanessa build a successful career rooted in trust, hard work, and client satisfaction.
A Well-Deserved Recognition
We are proud to celebrate Vanessa Wight’s continued success at BHGRE Green Team’s Goshen office. Her passion for real estate, expertise in the local market, and unwavering dedication to her clients make her an exceptional agent and a cherished member of our team.
Congratulations to Vanessa on another exceptional quarter! We are excited to see what the future holds as she continues to grow and inspire. If you’re looking for a real estate expert who will prioritize your needs and deliver incredible results, look no further than Vanessa Wight.
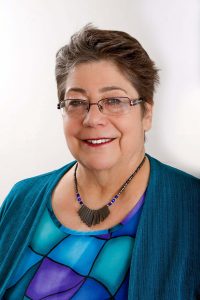
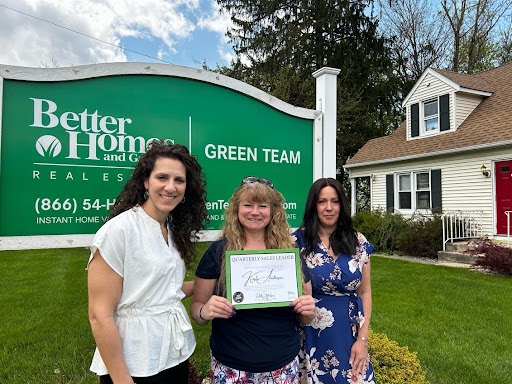
Congratulations to Vikki Garby: 2024 Q3 Sales Leader for BHGRE Green Team’s Warwick Office!
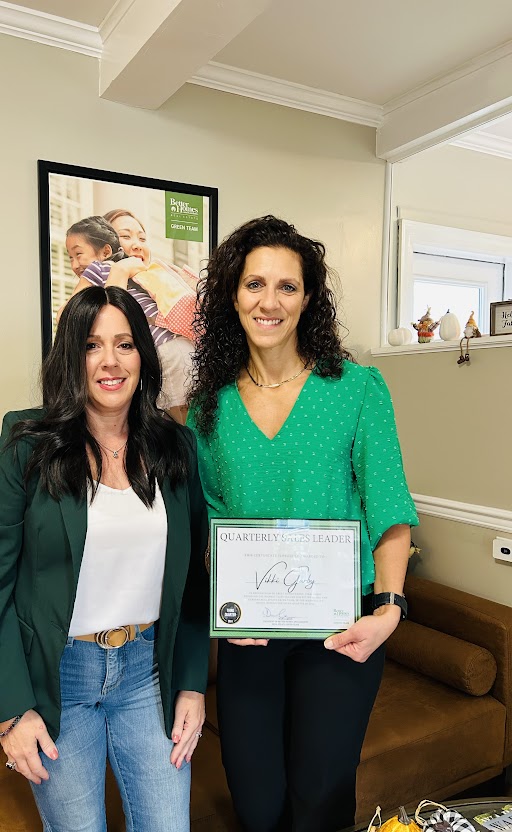
We are excited to announce that Vikki Garby has been named the 2024 Q3 sales leader for Better Homes and Gardens Real Estate Green Team’s Warwick office! Vikki’s commitment to her clients, passion for real estate, and tireless work ethic have helped her achieve this well-deserved honor, and we couldn’t be more thrilled to celebrate her success.
A Results-Driven Professional
Vikki’s success stems from her deep understanding of the real estate market and a results-driven approach that consistently delivers outstanding outcomes for her clients. Whether she’s working with buyers, sellers, or investors, Vikki brings a sharp focus and unwavering dedication to every transaction. Her ability to navigate the complexities of the real estate market and anticipate her client’s needs has made her a trusted and sought-after agent in the Warwick area.
Known for her proactive communication, attention to detail, and exceptional problem-solving skills, Vikki goes above and beyond to ensure that each client’s experience is smooth and successful. Her clients praise her ability to make them feel confident and informed throughout the entire process, resulting in long-lasting relationships and countless referrals.
Deep Local Knowledge Paired with Expertise
As a longtime resident and active member of the Warwick community, Vikki’s intimate knowledge of the local market is one of her greatest strengths. She is able to offer her clients invaluable insights into the area’s neighborhoods, schools, and market trends, giving them a competitive edge. Whether working with first-time homebuyers or seasoned investors, Vikki tailors her approach to meet her client’s specific goals, providing customized advice and strategies that maximize results.
Her ability to combine local expertise with a keen understanding of broader market dynamics allows Vikki to position her clients for success, no matter the challenge. Whether helping buyers find their dream home or guiding sellers in positioning their property to attract top offers, Vikki’s strategic mindset ensures exceptional results.
A Leader and Mentor
Beyond her impressive sales numbers, Vikki is a respected leader and mentor within the BHGRE Green Team. She is always eager to share her insights and support her colleagues, contributing to the collaborative and inclusive culture that defines our Warwick office. Vikki’s positive energy and willingness to help others achieve their goals have made her a valued resource and a respected figure among her peers.
Her leadership by example has not only earned her this quarter’s top spot but has also inspired those around her to reach new heights. Vikki embodies the team spirit we value at BHGRE Green Team, and her commitment to excellence helps elevate everyone she works with.
Client-First Mentality
What truly sets Vikki apart is her client-first mentality. She understands that real estate is not just about buying or selling properties—it’s about making life-changing decisions. Vikki takes pride in guiding her clients through these critical moments, offering thoughtful advice and personalized service every step of the way. Her honesty, integrity, and relentless focus on her clients’ needs have made her one of the most trusted agents in the Warwick area.
Her clients consistently highlight her dedication, noting that she listens carefully to their needs and works tirelessly to make their dreams a reality. Whether negotiating deals or navigating complex situations, Vikki’s calm and confident demeanor ensures that her clients feel supported and empowered.
Celebrating a Well-Earned Achievement
We are incredibly proud of Vikki Garby for earning the title of 2024 Q3 sales leader for our Warwick office. Her hard work, dedication, and passion for real estate are an inspiration to us all. This achievement is not just a reflection of her outstanding sales performance, but also of her commitment to excellence in everything she does.
Congratulations, Vikki! We are excited to watch your continued success as you lead with integrity, drive, and a true passion for helping others. Whether you’re looking to buy, sell, or invest, Vikki Garby is the trusted expert who can guide you through your next real estate journey.
Kristi Anderson, the 2024 Q3 Sales Leader for BHGRE Green Team’s Vernon Office!
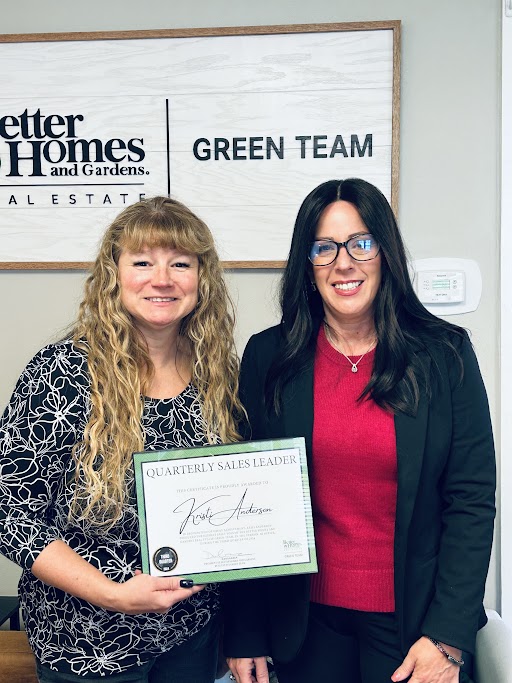
Kristi Anderson, the 2024 Q3 Sales Leader for BHGRE Green Team’s Vernon Office!
We are thrilled to announce that Kristi Anderson has been named the 2024 Q3 sales leader for Better Homes and Gardens Real Estate Green Team’s Vernon office. Kristi’s hard work, dedication, and commitment to excellence have led her to this outstanding achievement, and we couldn’t be prouder to celebrate her success!
Kristi has long been a vital member of our team, known for her market expertise, personalized client service, and unwavering dedication to helping clients find their dream homes or sell properties with ease. She brings a thoughtful, detail-oriented approach to every transaction, ensuring that her clients feel supported and informed throughout the entire real estate process.
A True Advocate for Her Clients
Kristi’s exceptional ability to truly listen to her clients and understand their unique needs sets her apart. Whether she’s working with first-time homebuyers, seasoned investors, or sellers, Kristi consistently goes above and beyond to ensure each transaction is smooth, efficient, and stress-free. Her deep knowledge of the local market allows her to provide valuable insights, giving her clients a competitive edge.
A Leader Among Peers
Kristi’s success is reflected in her sales numbers and the relationships she’s built within our team. Her peers recognize her as a trusted mentor and a valued resource, always willing to lend a hand or share her expertise. Her ability to inspire and collaborate with fellow agents adds to the positive, supportive culture we pride ourselves on at BHGRE Green Team.
Dedication to Excellence
This latest achievement is a testament to Kristi’s relentless work ethic and her passion for real estate. She has consistently set high standards for herself, and her accomplishments speak volumes about her dedication. As the 2024 Q3 leader for the Vernon office, she has not only demonstrated excellence in her own business but has also contributed significantly to the overall success of the team.
Congratulations, Kristi, on this well-deserved honor! We are excited to see what the future holds as you continue to shine and make an impact in the real estate industry.
Tom Folino Has Reached the 2024 Commission Cap!

Congratulations From Dana Green, President Of Better Homes and Gardens Real Estate Green Team, to Tom Folino for reaching the commission cap for Company Dollar Contribution in 2024!

“I am beyond excited to announce that Tom Folino has reached the CAP for 2024! Tom is not only an exceptional realtor but also an incredible team member who continuously goes above and beyond. He’s always eager to learn and grow as well as share his knowledge and assist the other members of our team with their own success. His dedication to his clients is unmatched, and his friendly, positive presence brightens our office every day. Congratulations, Tom! This achievement reflects your hard work and unwavering commitment to excellence. We’re so proud to have you as part of our Green Team family, and we can’t wait to see what else you accomplish!”
-Dana Green
Tom’s dedication to his clients and hard work has allowed him to reach the cap on her commission with BHGRE Green Team. This is an outstanding accomplishment and means Tom will now receive a 100% commission split on any deal he closes during 2024.

“I’m very thankful for the trust that my clients have placed in me to be their real estate agent, and I take that responsibility very seriously. My #1 priority is to help my clients achieve their goal of selling, buying, or renting. Without my clients, reaching the cap once again this year wouldn’t have been possible, So a big heartfelt Thank you to all of you who have placed that trust in me!
Reaching the cap is something all agents should be very proud of. In this business, it’s all about getting the job done for your clients while making the process as enjoyable and stress-free as possible for them. . When you teach the “Cap” it gives you a sense of accomplishment and is a reward for all of the hard work and commitment you have given to the process and more importantly, to your clients. I also want to thank our leadership team for giving us the tools we need to be successful in this business. The training, marketing and support that is offered definitely enhances our ability to be the Best we can be.”
Better Homes and Gardens Real Estate Green Team’s commission structure is undoubtedly one of the finest in the industry, but it doesn’t end there. Our lead generation platform, certified sales assistant program, and dynamic training systems are just a few other things worth mentioning.
Click here to learn more about Better Homes and Gardens Real Estate Green Team and why you should join our team.
Congratulations, Tom!
Pip Klein Has Reached the 2024 Commission Cap!
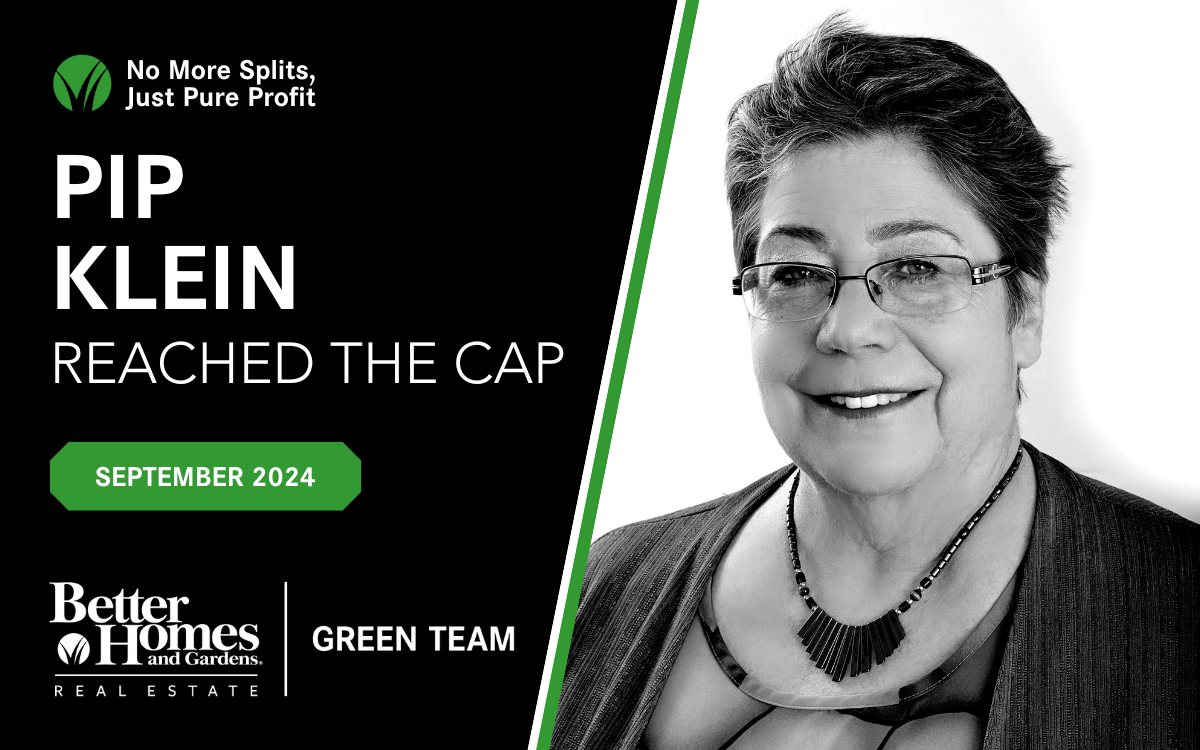
Congratulations From Dana Green, President Of Better Homes and Gardens Real Estate Green Team, to Pip Klein for reaching the commission cap for Company Dollar Contribution in 2024!
“I am incredibly proud to announce that Pip Klein has reached the CAP for 2024! Pip has been a wonderful member of our Green Team for the past 13 years, and her dedication and loyalty have made a lasting impact. She brings so much value to both our team and her clients, consistently going above and beyond to ensure success. Congratulations, Pip! We are so fortunate to have you as part of the Green Team family, and I can’t wait to see you continue to excel and inspire.”
-Dana Green
Pip’s dedication to her clients and hard work has allowed her to reach the cap on her commission with BHGRE Green Team. This is an outstanding accomplishment and means Pip will now receive a 100% commission split on any deal she closes during 2024.
“I’m so thankful that my real estate clients are so supportive and that their belief and trust me continues to grow my business… there are constant challenges and problem solving in every transaction but that’s what makes this such a fascinating career! I’m very appreciative of my 13 year “home”at Better Homes & Gardens Real Estate Green Team! ”
– Pip Klein
Better Homes and Gardens Real Estate Green Team’s commission structure is undoubtedly one of the finest in the industry, but it doesn’t end there. Our lead generation platform, certified sales assistant program, and dynamic training systems are just a few other things worth mentioning.
Click here to learn more about Better Homes and Gardens Real Estate Green Team and why you should join our team.
Congratulations, Pip!
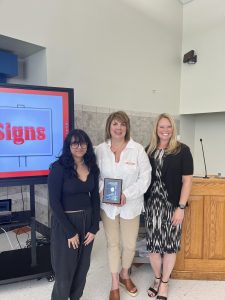
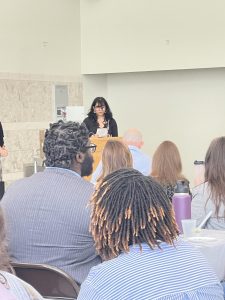
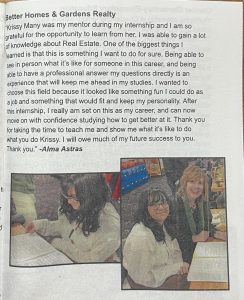
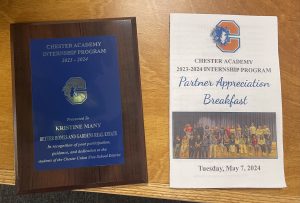
Krissy Many’s Heartfelt Impact in the Chester Academy Internship Program

Congratulations to Krissy Many, one of our bright stars at BHGRE Green Team, for her incredible work in the Chester Academy Internship Program. Krissy’s dedication to guiding young talent like Alma shows her passion for helping others grow in real estate.


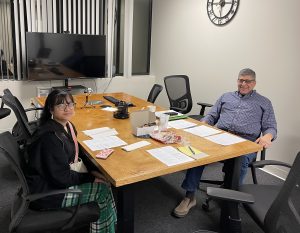
In her own words, Krissy shares her genuine gratitude for being part of this unique program:
“I feel truly honored to be part of this program. Alma, my intern, is such a smart and eager learner! She’s been diving into everything from leases to role-playing with enthusiasm. I’m really looking forward to continuing our journey together, helping her gain even more real-world knowledge and experience. And the appreciation breakfast this morning? It was fantastic! Meeting so many amazing students and professionals from our community who generously shared their time and wisdom was truly inspiring. Big thanks to Jennifer Burretto for organizing such an enriching experience for the students at Chester Academy and for inviting me to be a part of it.”
Krissy’s warmth and dedication shine through in her words. She’s not just mentoring Alma; she’s building a real connection and sharing her passion for real estate.
The Chester Academy Internship Program is all about giving students like Alma hands-on experience and valuable industry connections. Krissy’s involvement isn’t just about ticking a box; it’s about making a real difference in someone’s life.
As Krissy Many continues to illuminate the path for others, we are profoundly proud to have her as a beacon of our team. Her unwavering commitment to uplifting others epitomizes the values we hold dear at Better Homes and Gardens Real Estate Green Team.
Congratulations, Krissy, on this well-deserved recognition. Your kindness and dedication inspire us all, and we can’t wait to see where your journey takes you next.
Congratulations Kristi Anderson!
Kristi is the 2024 First Quarter Sales Leader for BHGRE Green Team’s Vernon Office!
We are thrilled to congratulate Kristi Anderson for her remarkable achievement of once again clinching the title of Sales Leader for the 1st quarter of 2024. This achievement marks the second consecutive quarter that Kristi has emerged as the top performer in our BHGRE Green Team’s Vernon, NJ office.
A Legacy of Excellence
Kristi’s exceptional skills, industry knowledge, and unparalleled commitment to her clients have consistently set her apart. Her relentless pursuit of excellence and passion for helping clients find their dream homes have made her a trusted and respected name in the real estate industry.
Continued Success
Kristi’s impressive track record speaks for itself. Not only has she once again achieved the position of quarterly Sales Leader, but she has also continued to exceed expectations with her outstanding performance. Her ability to consistently deliver exceptional results is a testament to her unwavering dedication and extraordinary accomplishments.

Additionally, this recent achievement adds another accolade to Kristi’s already impressive resume. Kristi received Gold Level recognition at the New Jersey Circle of Excellence Awards, the BHGRE Gold Sales Award, and the Citizen of the Year award for her valuable contributions and outstanding support to our community. Her previous sales leadership accomplishments show Kristi’s commitment to excellence shines through in every aspect of her work.
Going Above and Beyond

What sets Kristi apart is her dedication to ensuring a stress-free experience for her clients. In addition to her exceptional service, Kristi goes above and beyond by providing a unique benefit to her clients – her very own moving truck. Any of Kristi’s buyers or sellers in New York can use this truck free of charge, saving them time, money, and hassle. This thoughtful gesture reflects Kristi’s commitment to her client’s satisfaction and underscores her reputation as a real estate agent who truly cares.
Congratulations, Kristi!
We are immensely proud to have Kristi Anderson as a valued member of our team. Her continued success is a testament to her hard work, dedication, and unwavering commitment to excellence. Congratulations, Kristi, on another well-deserved achievement. Here’s to many more milestones together!
Housing Experts Say This Isn’t a Bubble

With so much talk about an economic slowdown, some people are asking if the housing market is heading for a crash like the one in 2008. To really understand what’s happening with real estate today, it’s important to lean on the experts for reliable information.
Here’s why economists and industry experts say the housing market is not a bubble ready to pop.

Today Is Nothing Like 2008
The 2008 housing crash is still fresh in the minds of many homebuyers and sellers. But today’s market is different. Odeta Kushi, Deputy Chief Economist at First American, says:
“This is not the same market of 2008. . . . It’s no secret the housing market played a central role in the Great Recession, but this market is just fundamentally different in so many ways.”
Natalie Campisi, Advisor Staff for Forbes, explains how today’s lending standards are different than those during the lead-up to the housing market crash:
“Among the differences between today’s housing market and that of the 2008 housing crash is that lending standards are tighter due to lessons learned and new regulations enacted after the last crisis. Essentially, that means those approved for a mortgage nowadays are less likely to default than those who were approved in the pre-crisis lending period.”
Another reason today’s housing market is nothing like 2008 is that the number of people looking to buy a home still outweighs the supply of homes for sale. As realtor.com notes:
“. . . experts don’t believe the market is in a bubble or a crash is in the cards, like during the Great Recession. The nation is still suffering from a housing shortage that has reached crisis proportions at a time when many millennials are reaching the age when they start to consider homeownership. That’s likely to keep prices high.”
Bottom Line
Experts say the housing market isn’t a bubble, and we’re not heading for a crash. Let’s connect so you can have a full picture of today’s housing market in our local area.
Expert Housing Market Forecasts for the Second Half of the Year

The housing market is at a turning point, and if you’re thinking of buying or selling a home, that may leave you wondering: is it still a good time to buy a home? Should I make a move this year? To help answer those questions, let’s turn to the experts for projections on what the second half of the year holds for residential real estate.
Where Mortgage Rates Will Go Depends on Inflation
While one of the big questions on all buyers’ minds is where will mortgage rates go in the months ahead, no one has a crystal ball to know exactly what’ll happen in the future. What housing market experts know for sure is that the record-low mortgage rates during the pandemic were an outlier, not the norm.
This year, rates have climbed over 2% due to the Federal Reserve’s response to rising inflation. If inflation continues to rise, it’s likely that mortgage rates will respond. Greg McBride, Chief Financial Analyst at Bankrate, explains it well:
“Until inflation peaks, mortgage rates won’t either. Without improvement on the inflation front, we don’t know where the interest rate ceiling will be.”
Whether you’re buying your first home or selling your current house to make a move, today’s mortgage rate is an important factor to consider. When rates rise, they impact affordability and your purchasing power. That’s why it’s crucial to work with a team of professionals, so you have expert advice to help you make an informed decision about your best move.

The Supply of Homes for Sale Projected To Continue Increasing
This year, particularly this spring, the number of homes for sale has grown. That’s partly due to more homeowners listing their houses, but also because higher mortgage rates have helped ease the intensity of buyer demand. Moderating buyer demand slows down the pace of home sales, which in turn helps inventory rise.
Experts say that growth will continue. Recently, realtor.com updated their 2022 inventory forecast. In the latest release, they increased their projections for inventory gains dramatically, going from a 0.3% increase at the beginning of the year to a 15.0% jump by the end of 2022 (see graph below):
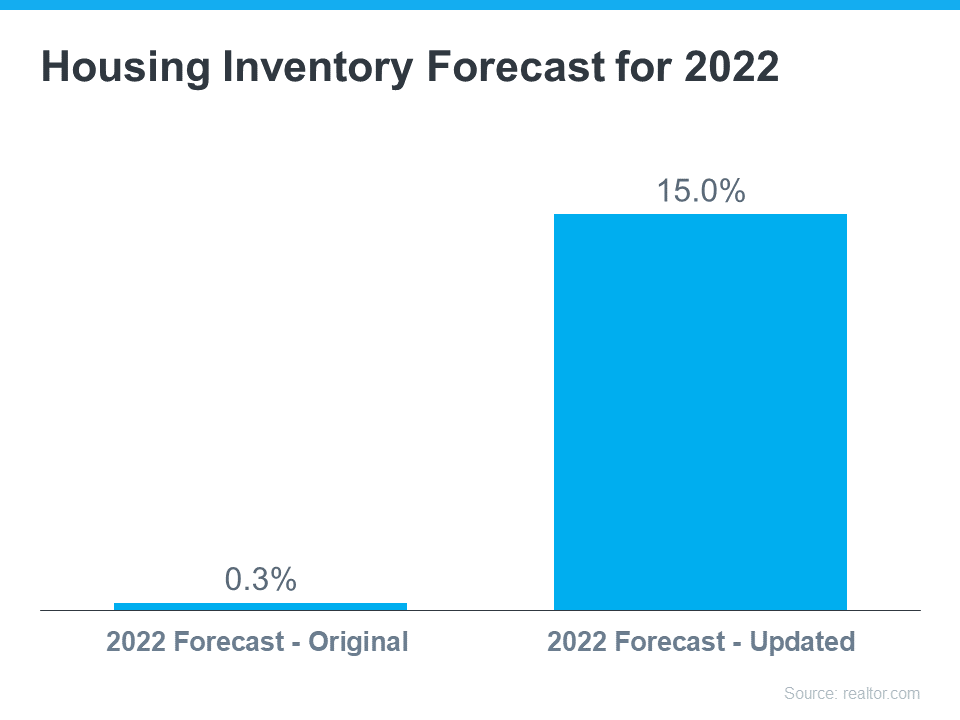
More homes to choose from is great news if you’re craving more options for your home search – just know that there isn’t a sudden surplus of inventory on the horizon. Housing supply is still low, so you’ll need to partner with an agent to stay on top of what’s available in your market and move fast when you find the one. It’s not going to be easy to find a home, but it certainly won’t be as difficult as it has been over the past two years.
Home Price Forecasts Call for Ongoing Appreciation
Due to the imbalance between the number of homes for sale and the number of buyers looking to make a purchase, the pandemic led to record-breaking increases in home prices. According to CoreLogic, homes appreciated by 15% in 2021, and they’ve continued to rise this year.
Even though housing supply is increasing today, there are still more buyers than there are homes for sale, and that’s maintaining the upward pressure on home prices. That’s why experts are not calling for prices to decline, rather they’re forecasting they’ll continue to climb, just at a more moderate pace this year. On average, homes are projected to appreciate by about 8.5% in 2022 (see graph below):
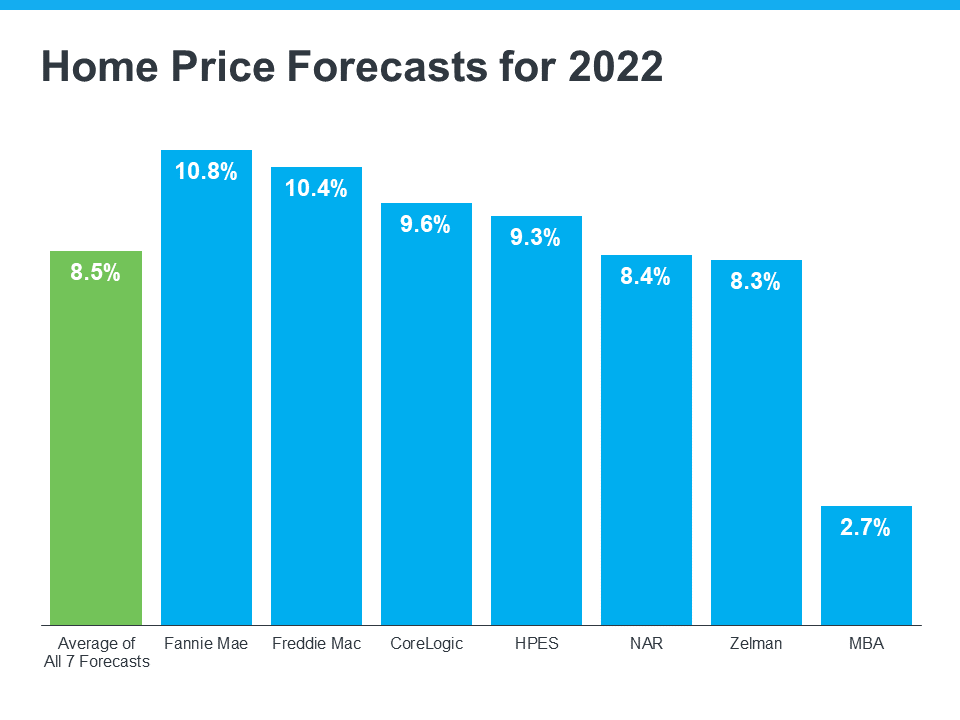
Selma Hepp, Deputy Chief Economist at CoreLogic, explains why the housing market will see deceleration, but not depreciation, in prices:
“The current home price growth rate is unsustainable, and higher mortgage rates coupled with more inventory will lead to slower home price growth but unlikely declines in home prices.”
For current homeowners looking to sell, know your home’s value isn’t projected to fall, but waiting to make your purchase does mean your next home could cost more as home prices continue to appreciate. That’s why, if you’re thinking about buying your first home or you’re ready to make a move, it may make sense to do so now before prices climb higher. But rest assured, once you buy a home, that price appreciation will help grow the value of your investment.
Bottom Line
Whether you’re a homebuyer or seller, you need to know what’s happening in the housing market, so you can make the most informed decision possible. Let’s connect to discuss your goals and what lies ahead, so you can determine the best plan for your move.
What Does an Economic Slowdown Mean for the Housing Market?

According to a recent survey, more and more Americans are concerned about a possible recession. Those concerns were validated when the Federal Reserve met and confirmed they were strongly committed to bringing down inflation. And, in order to do so, they’d use their tools and influence to slow down the economy.
All of this brings up many fears and questions around how it might affect our lives, our jobs, and business overall. And one concern many Americans have is: how will this affect the housing market? We know how economic slowdowns have impacted home prices in the past, but how could this next slowdown affect real estate and the cost of financing a home?
According to Mortgage Specialists:
“Throughout history, during a recessionary period, interest rates go up at the beginning of the recession. But in order to come out of a recession, interest rates are lowered to stimulate the economy moving forward.”
Here’s the data to back that up. If you look back at each recession going all the way to the early 1980s, here’s what happened to mortgage rates during those times (see chart below):
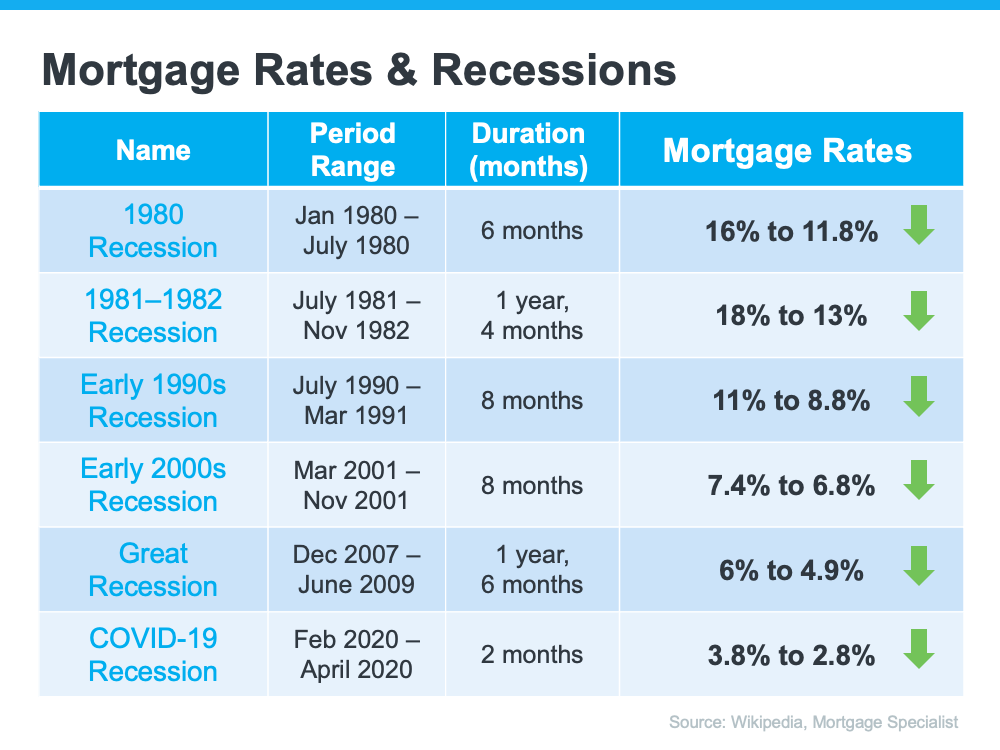
As the chart shows, historically, each time the economy slowed down, mortgage rates decreased. Fortune.com helps explain the trend like this:
“Over the past five recessions, mortgage rates have fallen an average of 1.8 percentage points from the peak seen during the recession to the trough. And in many cases, they continued to fall after the fact as it takes some time to turn things around even when the recession is technically over.”
And while history doesn’t always repeat itself, we can learn from it. While an economic slowdown needs to happen to help taper inflation, it hasn’t always been a bad thing for the housing market. Typically, it has meant that the cost to finance a home has gone down, and that’s a good thing.

Bottom Line
Concerns of a recession are rising. As the economy slows down, history tells us this would likely mean lower mortgage rates for those looking to refinance or buy a home. While no one knows exactly what the future holds, you can make the right decision for you by working with a trusted real estate professional to get expert advice on what’s happening in the housing market and what that means for your homeownership goals.


