Choosing whether to rent or buy a home is not an easy decision. It requires you to carefully examine the factors and costs associated with each option. Which is better? That depends.
Your unique economic situation, lifestyle and goals play the largest part in deciding what is better for you. It’s important to go into your calculations with open eyes. As much as you want a home, you may not be able to afford it. Or it may not be the right decision for the way you like to live.
Factors To Consider When Buying/Renting a Home
The following four points are the largest factors to consider when weighing the pros and cons of home ownership vs. rental.
1) What are the total costs?
Many people look at the economics of home-ownership as a mortgage payment only. In reality there are insurance, repairs, property tax, homeowners association dues etc. that all have to be factored in to your monthly costs. Check out this calculator from the New York Times to see more.
Use a calculator and compare to see if:
The monthly cost as a homeowner is less than renting.
You can afford the monthly cost (if it works out more than renting in your area)
Saving a 10-20% down-payment is feasible for you
If owning a home definitely the way to go for you, you need to be able to answer the above questions definitively.
2) What is important to you?
Are you more interested in building for the future, or reducing your financial risk until you can figure out a plan? You may want to own if you are thinking about starting a family. But as someone who is single, you may enjoy your freedom and having less financial debt. (Even if it is building your net worth in the long run)
Undoubtedly, buying a house only makes sense if you plan to set up roots. If you plan to move within (or every) 5 years, your transaction costs will likely bring the equity you build in your house to zero. Thus diminishing your upside while carrying all of the liabilities that come along with home ownership. Owning a home is a smart decision if you plan to stay for 10 years or more.
3) What is your preferred lifestyle?
Do you want to build a career in a specific city or travel around? Do you have long-term goals in mind? It’s okay if you don’t. The most important part is being aware of where you are at. You may want to get some international work experience or try your luck in another part of the country. Or not.
Really think about what you want. You could lose some serious money if you buy a house and sell within a few years because you decide it isn’t for you.
4) What are the opportunity costs?
Think about the pros and cons of home-ownership. On one hand, you will always have a home base. On the other, you have a property that ties you down to a geographical location. Can you make more money in another city? With a home, you can’t move to pursue those opportunities.
If rent is equal to monthly payments as an owner, think about the opportunity costs of having all of your money tied up in the house. For example, some investors may rent and opt to invest their money in the stock-market or other investments in their portfolio. Can you make higher percentage returns yearly with the money you would be using for a down payment?
The above were things you will want to consider. If you need to be realistic to make the right decision about renting vs owning a home. The below two situations may help if you aren’t able to come to a conclusion.
When is Renting a Home Better?
Despite popular belief, owning a home is not always the best decision. Let’s not be black and white. It depends on your particular situation.
You may want to rent if:
You want to travel and set-up shop in different places every few years.
You do not have the job or financial security to (realistically) guarantee payments for years to come.
You have demonstrated the ability to make better financial returns through other investments.
There are other factors. However, this is a good starting point to help you determine your argument for renting versus owning a home. The benefit of renting is not being tied down to a geographic location and being able to leave when your lease runs up.
When is Owning a Home Better?
Owning a home is the long-term game. You need to have your goals in mind and understand if you can afford it.
You may want own if:
You are okay with staying in one place for 10 years or more.
You have the financial stability to afford the home (and float payments if you lose your job)
You want to leverage your home as an investment property down the line (through rental)
Owning a home gives you an anchor. It helps you stay grounded by having a home base. At the same time, you can increase your upward potential by leveraging the home as an investment property.
Some food for thought
Choosing to rent or own your home is a big decision. It depends on your individual situation and vision for the future. In short, owning is traditionally the better long-term strategy. However, that’s not to say that you can’t do as good or better with the right investment portfolio.
Before jumping into anything, analyze yourself. Think hard about where you are and what you want for the future. Speak to a realtor and see if they have any advice for your individual situation.
If you are looking at purchasing property in the area, give Green Team Realty a call. We’d love to discuss your options and see if buying is the right path for you.
The August Housing Market Update was held live on Facebook on Tuesday, August 14, at 9 a.m. If you missed the live webinar, you can view it at your convenience by clicking here.
Next month, the Housing Market Update webinar will take place on Tuesday, September 18 at 2 p.m. You can sign up for updates at GreenTeamHQ.com/HMU.
Meet the Panel
Geoff Green
Keren Gonen
Patrick Keelin
Jeff Lobb
Geoff Green moderated the webinar and presented statistics for Orange and Sussex Counties. Keren Gonen, of Green Team Real Estate New Jersey and Green Team Home Selling System, gave her perspective on the market from the sales associate’s view. Guest panelists were Patrick Keelin, Branch Manager of Family First Funding’s Warwick office, and Jeff Lobb, Founder and CEO of SparkTank Media. Green Team’s Marketing Director, Melissa Bressette, was on hand to make sure everything ran smoothly.
Housing Market Update – National
Nationally, for the last two months, the number of homes selling is down slightly from 2017. Earlier in the year it was almost even. There is a mixed bag, not a continued trend. Common knowledge says it’s all about inventory. There are just not enough homes for all the buyers out there.
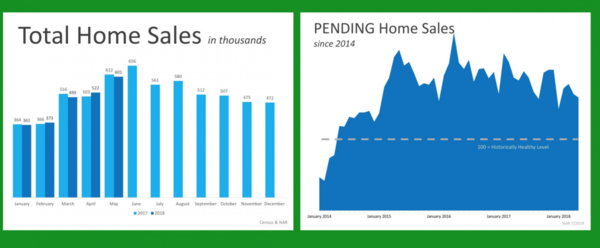
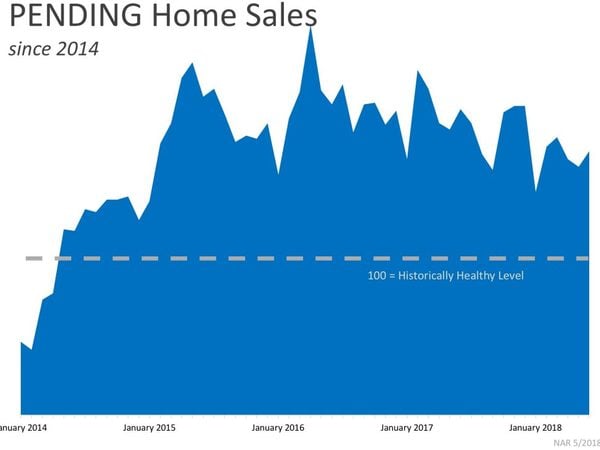
Pending home sales seem to be trending downward nationally.
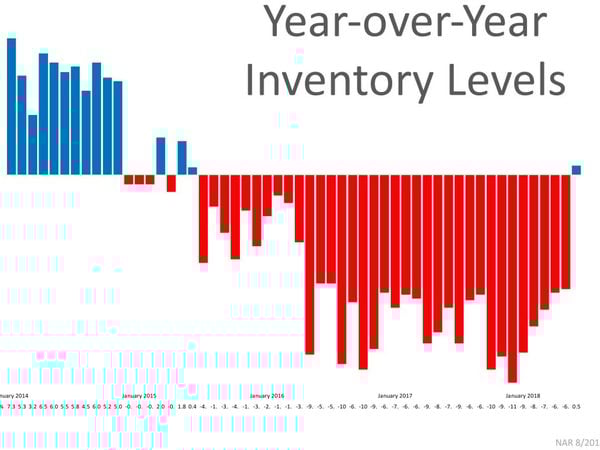
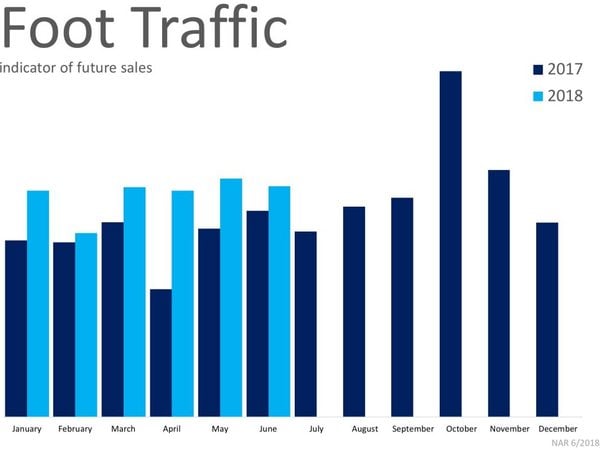
The National Association of Realtors shows year-over-year inventory levels up for the first time in 36 months. It may be a good sign, though it may also be indicative of the market slowing a little. However, foot traffic is up in 2018, compared to 2017. This graphic represents the numbers of people actually in homes, looking to buy. This number has been up consistently all year, though sales are down on a national level. From a national perspective, it’s still a very solid market.
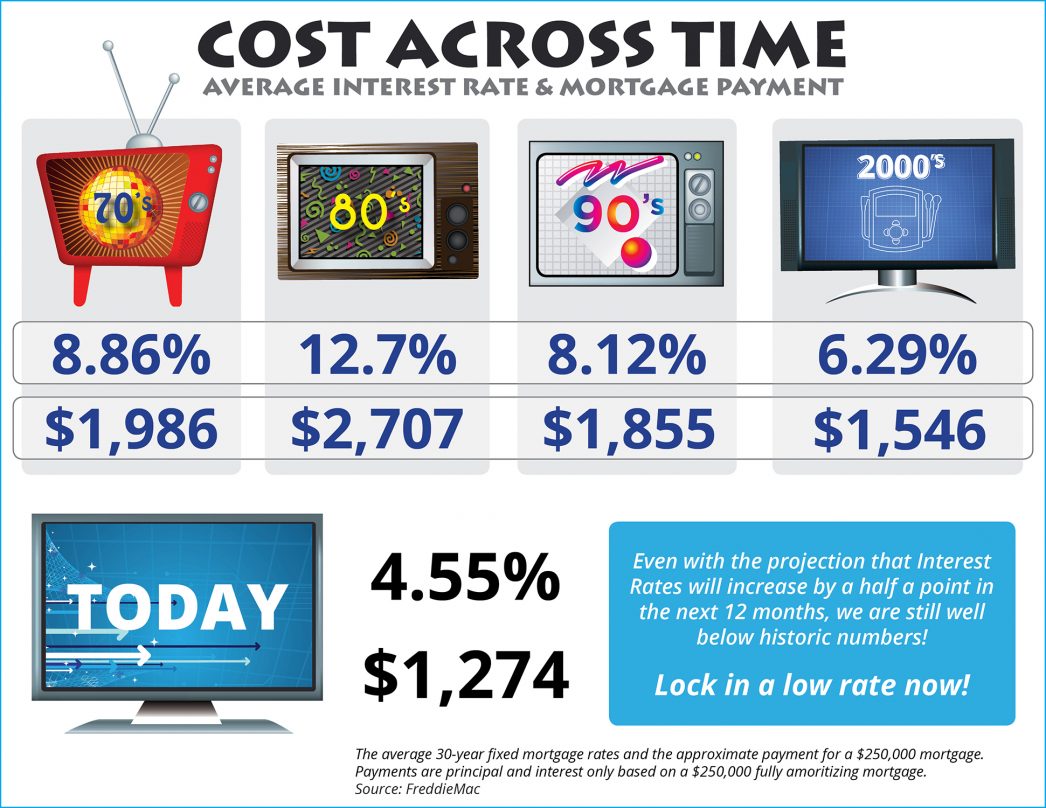
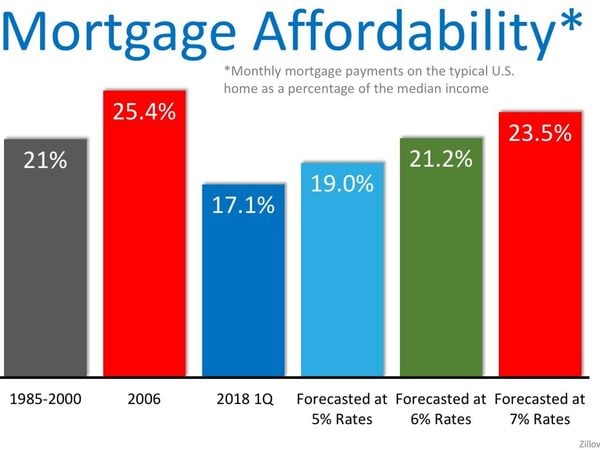
From 1985 to 2000, 21% of household income was dedicated to mortgage payments. In the first quarter of 2018 we’re well below that number. At 17.1%, we’re about 4 points below the historical average over the last 25 years. Therefore, even though prices are rising and inventory is tight, homes are still relatively affordable compared to 1985 to 2000. Even if rates do get to 6% or so, household income dedicated to mortgage payments will be only a few points higher than the 1985 to 2000 average.
Housing Market Update – Orange County, NY
Getting down to local stats, although at a slowing pace, the numbers are still at historical levels. In our area, where the current number of homes selling is the equivalent of 2006 (which was one year after the absolute peak in the market that occurred in 2005), the rate of sales is historically very high. This is a very hot market.
Average price is clearly rising in 2018. Geoff noted that in his experience units sold would increase, but average price didn’t quite get there. Then, units sold would start to decrease but price didn’t follow that trend, with a lag of about 6 months. There was almost a 2-year lag in average price that came after the downturn in the market.
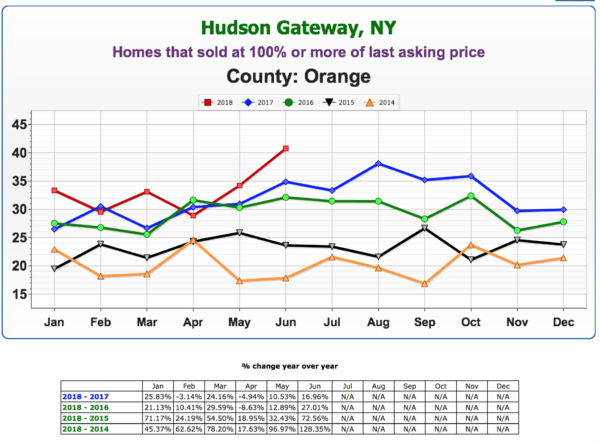
Approximately 40% of homes are selling at 100% or more of their last asking price. There are a lot of bidding wars going on, and this is indicative of how hot the current market is.
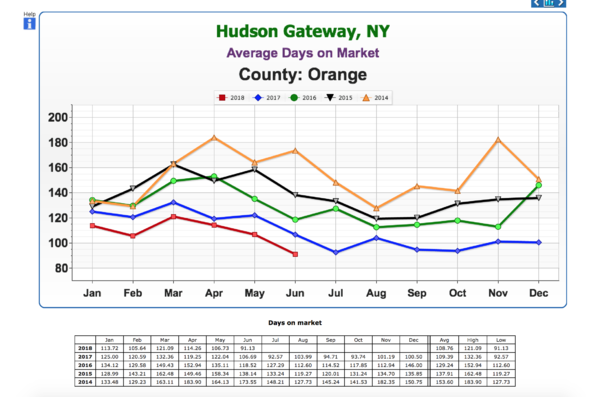
This number continues to decline, another sign that this market is hot.
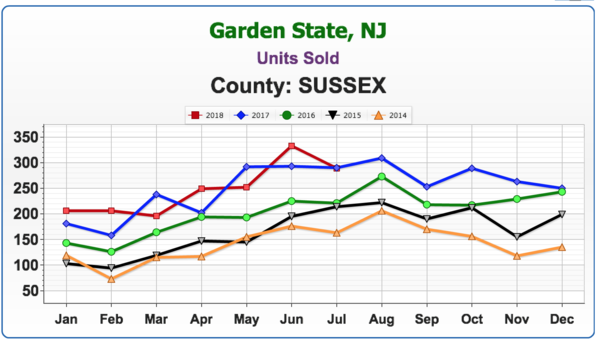
Housing Market Update – Sussex County, NJ
The stats are showing a fluctuation in the number of units sold in Sussex County. It’s a mixed bag – some months below, some months above. No definitive trend has emerged.
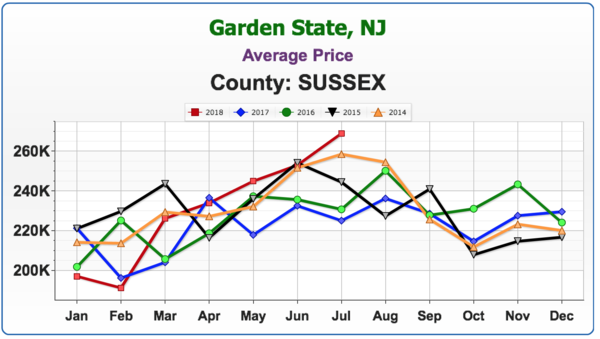
Not quite the lift-off that’s occurring in Orange County, but after the first two months of 2018, there is a definite rise in average price and July is at the highest point of the last five years.
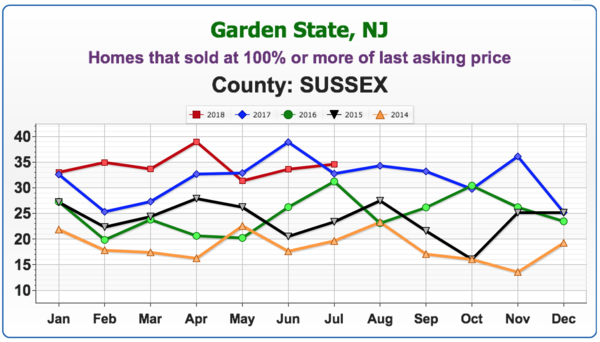
While not quite as high as Orange County, between 30 to 40% of homes are selling at 100% or more of last asking price.
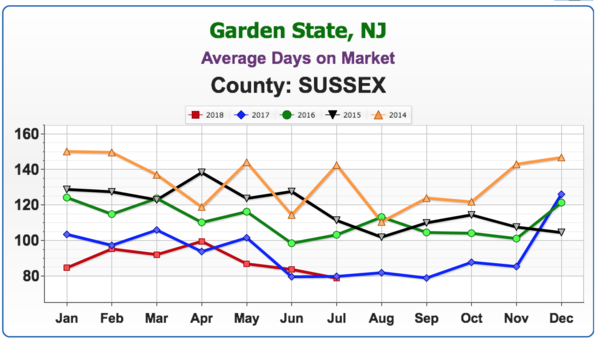
We’re seeing a similar trend to New York, with homes selling at around the 90-day mark.
Keren Goren – A Sales Associate’s Perspective on the Market
Geoff asked Keren Goren, one of Green Team’s top producers, for her thoughts on the current market. Licensed in both New York and New Jersey, Keren finds that there are many prospective buyers for both Orange and Sussex Counties. Lots of bidding wars are going on.
She does feel that some of the flippers in the area are doing less and asking for more. This appears to be a new trend. Keren recalled that flippers used to do a much better job, but many houses on the market now are unfinished and are scaring buyers away as opposed to inviting bids. Therefore, some outdated homes are actually selling for prices higher than they should or would have a few months ago.
Keren sees no sign of the market slowing down. However, she is seeing delays in closings due to issues with some mortgage companies, and with buyers making poor decisions with their finances. Keren did note that her experiences with Family First were extremely positive, and she highly recommended them.
Geoff noted that the current market upturn stands a chance at longevity. Following the downturn, as deep and as long it was, people weren’t moving. Banks have since cleaned up their balance sheets, tightened programs up, and are making money. There are fewer defaults happening. Basically, everything depends on how much money the banks are willing to lend.
PJ Keelin – A Lender’s Perspective
The mortgage industry is doing well, offering a lot more first-time homebuyer programs with as little as 3% down, USDA becoming very popular in Orange and Sussex County areas. Also trending is loosening up a bit and coming up with more portfolio loan products, personal products and using common-sense underwriting and ability to fund when looking at today’s borrowers.
With homes in the $200,000 to $300,000 price range becoming few and far between, they are looking at different programs, such as adjustable rates, less money down, and interest only type payments. However, in these cases, information and education should be given to borrowers upfront. It’s necessary to prepare the borrower for everything that will come together throughout the process. It’s extremely important for borrowers to be aware of what they are getting into with these products and understand how they work.
Geoff noted that with the last downturn, banks were not requiring people to have much “skin in the game.” Zero down, lying about income, jamming loans through. Geoff asked if PJ was seeing any of those practices coming back, or if there remains more oversight. scrutinizing income and the buyer’s comprehensive financial situation, down payments, etc. before loans are going out.
PJ replied that FANNIE and FREDDIE are doing a great job operating more with common sense with people who can have a little more risk, etc. They are requiring more skin in the game. Banks are protecting themselves and borrowers by not letting people put themselves under water.
Where are mortgage rates headed?
Geoff noted that the Fed has been raising short-term interest rates and will probably continue to do so to stifle inflation. He asked PJ where he saw mortgage rates landing over the next 12 to 18 months. PJ answered that he believes rates will be consistently in the 5’s through most programs. The market is being built into where those rates are and is slowly trending. Supply and demand are balancing each other out. Geoff feels that if you buy now, the value of your home won’t drop out like it did 12, 14 years ago. Pricing levels appear to be realistic and should hold for some time in the future. Buyers want to know if the asset they’re buying will be worth at least as much or more than they’re paying now. Even though it is a seller’s market, Geoff and PJ concurred that it is a good time to buy.
Furthermore, PJ stated that appraisers are not allowing appraisal inflation to come above where the market truly should be. It’s better for appraisers to be a little tight because that will keep the longevity of this strong market going on for 12, 18, 24 months. Geoff replied that appraisals have been challenging over the last 3 years. Prior to the upturn, prices were a mixed bag, leaving appraisers unwilling to take a chance as they couldn’t see where the market was going. However, he noted that now some appraisers are more willing to take a chance and make an allowance because of the steady upward-trending market, even though there might not be a comp that can exactly substantiate it. There are fewer appraiser issues, though there are still times when they won’t go along with the offering price. This hurts the seller but protects the buyer. And it’s another way of controlling the market.
Jeff Lobb – A Marketing Expert’s Perspective
Geoff asked Jeff for his views on the future of service providers in the real estate industry in this age of technology. Are realtors going to be the next victims of business models like Amazon? Will technology replace realtors just as retail stores (like ToysRUs) and their employees have been replaced?
Jeff’s view? While buzzwords like “disruption” do sell media, there are things happening at higher levels. However, the real estate agent is not going away anytime soon for one simple reason. There are too many moving parts to a transaction, and emotion is one of those. Technology has not reached the stage where it can handle all these parts.
Disruption occurs with more brands trying to change the way we are doing business, making it faster, more tech, or more niche. New companies are coming into play. Compass, Redfin models, Purple Bricks. And new people are coming into the space trying to change and elevate what we do. At the same time. the industry has seen some large teams leave major brands, saying they can do things better by themselves, without the big brand box.
Taking care of business…
One way to keep track of business is to every day look at local inventory. If there are 500 listings, see how many of those you got. If it’s only 2, there is a lot to be done. The business is a marathon; it’s a competitive race, but not many have enough drive to do the hard work that’s needed. To say the business is slow is not valid. Every day more homes come on the market and more get sold. Someone is getting those listings. And that is where the challenge comes in. It’s about doing the day-to-day work. All the technology that is available can make us work faster and smarter, but we still have to do the work.
Philosophically speaking…
Geoff has a broader perspective as to where realtors stand and what the future holds. As an example, despite all the tools available online there are more travel agents now than in the year 2000. It takes time to do all the research, etc., and many people are finding it more desirable to hire someone to do that work for them.
There has been an explosion of information and technology, but at the end of the day, it’s time. Do most people want to spend the amount of time it takes to properly sell their house or negotiate to buy a home? Most people prefer to hire a real estate professional to handle all the parts of the puzzle. In addition, Geoff believes the housing market is important to the overall US and global economy. The economy is revving. largely because of the housing market healing and coming back. And real estate agents are critical to the health of the economy.
Jeff added, “Will Amazon and Facebook get into the real estate marketplace? Probably!” The big picture is that some companies are coming in trying to acquire agents and market share. Others are trying to change the way technology is driven. However, you still need the people to execute the transactions and deal with the emotional process of a sale.
Geoff’s final analysis? We, humans, are complicated beings, and it takes a human to navigate this process of buying a home. And after much consideration, we should continue to invest in real estate agents and our industry because we’re needed and timeless.
Visit our website, greenteamhq.com/HMU to register for our next Webinar on Tuesday, September 18 at 2 pm. You can also view previous webinars videos and access other recaps like this.
The Green Team is pleased to announce that Vikki Garby has received her Commercial and Investment Real Estate Certification. Vikki’s new certification, coupled with her previous work experience, further strengthens her skill set when it comes to assisting real estate investors and commercial clients. Not only is she Commercial and Investment Real Estate Certified (CIREC). Her own experience informs her knowledge and ability.
A 1997 graduate of Cornell University, Vikki worked for Deutsche Bank in New York City as an investment banker. There she reviewed and negotiated complex contracts on a regular basis. During that time, she also became a real estate investor. And she negotiated transactions as a buyer. Her love of real estate and her skill at navigating its many transactional parts lead her to obtain her license so that she could help others
The CIREC Program
The intensive CIREC program covers a wide range of topics vital to commercial and investment transactions. Among them are the financial related aspects. These include tax implications of selling a property, 1031 Exchanges, valuing properties for sellers, preparing a financial analysis of properties for investors, and comparing financial impacts of leasing vs. buying for user buyers.
So you made an offer, it was accepted, and now your next task is to have the home inspected prior to closing. Oftentimes, agents make your offer contingent on a clean home inspection.
This contingency allows you to renegotiate the price you paid for the home, ask the sellers to cover repairs, or even, in some cases, walk away. Your agent can advise you on the best course of action once the report is filed.
How to Choose an Inspector
Your agent will most likely have a shortlist of inspectors that they have worked with in the past that they can recommend to you. HGTVrecommends that you consider the following 5 areas when choosing the right home inspector for you:
Qualifications – find out what’s included in your inspection and if the age or location of your home may warrant specific certifications or specialties.
Sample Reports – ask for a sample inspection report so you can review how thoroughly they will be inspecting your dream home. The more detailed the report, the better in most cases.
References – do your homework – ask for phone numbers and names of past clients who you can call to ask about their experiences.
Memberships – Not all inspectors belong to a national or state association of home inspectors, and membership in one of these groups should not be the only way to evaluate your choice. Membership in one of these organizations often means that continued training and education are provided.
Errors & Omission Insurance – Find out what the liability of the inspector or inspection company is once the inspection is over. The inspector is only human after all, and it is possible that they might miss something they should have seen.
Ask your inspector if it’s okay for you to tag along during the inspection, that way they can point out anything that should be addressed or fixed.
Don’t be surprised to see your inspector climbing on the roof or crawling around in the attic and on the floors. The job of the inspector is to protect your investment and find any issues with the home, including but not limited to: the roof, plumbing, electrical components, appliances, heating & air conditioning systems, ventilation, windows, the fireplace and chimney, the foundation, and so much more!
Bottom Line
They say ‘ignorance is bliss,’ but not when investing your hard-earned money into a home of your own. Work with a professional who you can trust to give you the most information possible about your new home so that you can make the most educated decision about your purchase.
Learn More about the home buying process, request our Home Buyers Guide or visit our Home Buyers Blog
[/et_pb_text][/et_pb_column][/et_pb_row][et_pb_row custom_padding=”12px|0px|17.5781px|0px|false|false” _builder_version=”3.18.2″ locked=”off”][et_pb_column type=”4_4″ _builder_version=”3.18.2″ parallax=”off” parallax_method=”on”][et_pb_blog fullwidth=”off” posts_number=”3″ include_categories=”34″ show_author=”off” show_date=”off” show_categories=”off” _builder_version=”3.18.2″ header_level=”h5″ header_font=”||||||||” body_font=”||||||||” border_radii=”on|12px|12px|12px|12px” text_orientation=”center”][/et_pb_blog][/et_pb_column][/et_pb_row][/et_pb_section]
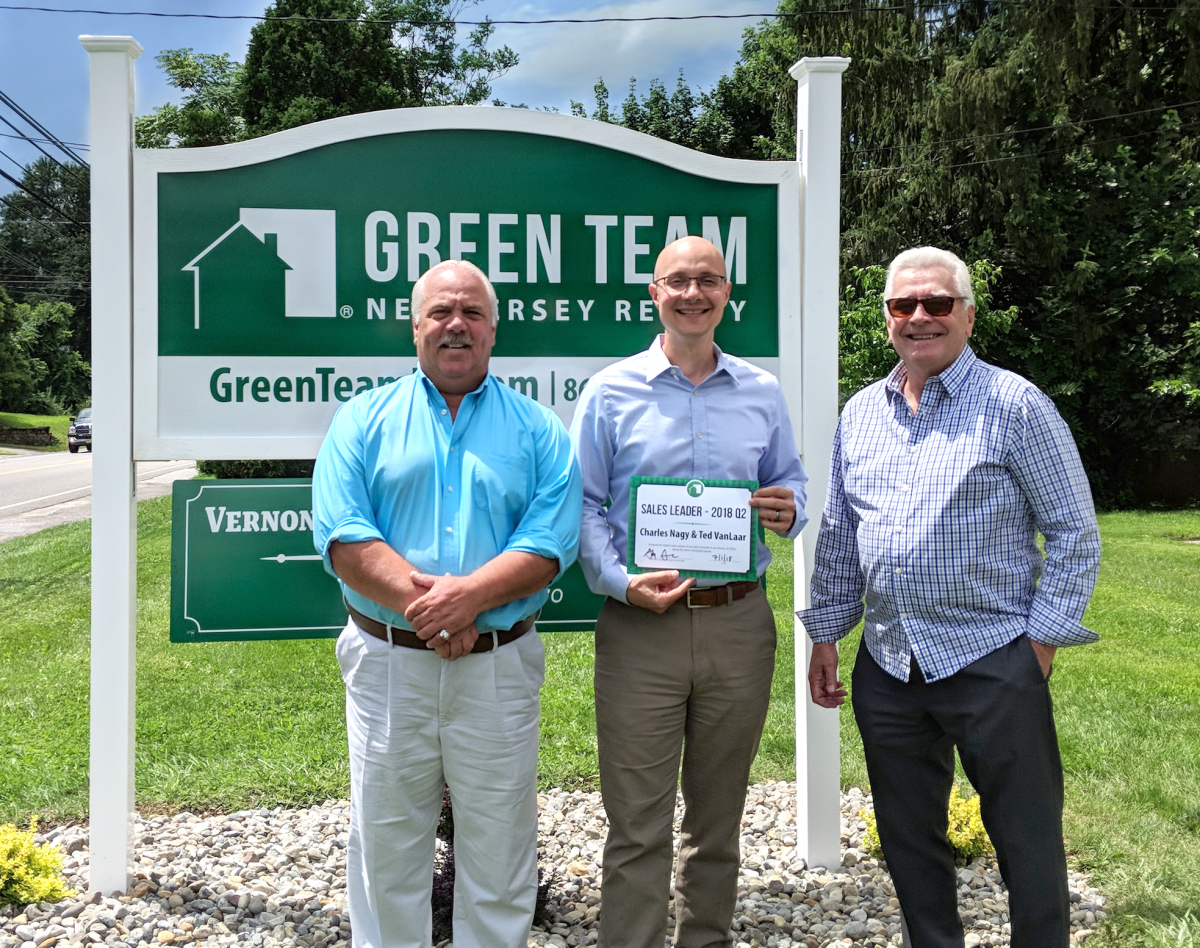
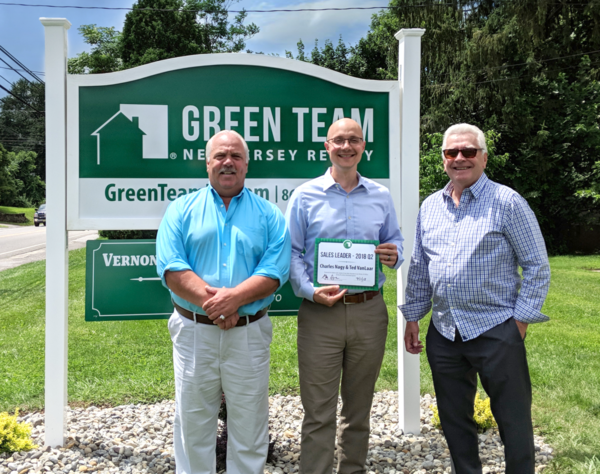
Green Team New Jersey Realty is pleased to announce that Charles Nagy and Theodore Van Laar have won the Second Quarter Sales Leader Award for the second year in a row.
As Geoff Green likes to call them, the “Dynamic Duo” took home the prize for Second Quarter Sales Leader in 2017, as well as this year. This team’s commitment to GTNJR and the clients they serve are part of the reason the New Jersey office is experiencing its rapid growth and success.
Over 7 Decades of Experience Combined
Their experiences in the real estate industry differ, yet they complement each other. Ted Van Laar’s specialty is resort properties. Back in 1979 Ted and his wife, Rosanne, became attracted to the beauty, lifestyle, and amenities offered in Vernon’s resorts. Through the years they have shared their love and enjoyment of Mountain Creek, Crystal Springs and Great Gorge resort area with their three children. They’ve also shared it with friends, family and Ted’s many clients.
Ted has a reputation for integrity and honesty, as well as appreciation and understanding of the resort lifestyle. Therefore, his clients like and trust his expertise, whether they’re looking for a private residence, second home or investment property.
Charles and wife Lynne live in Crystal Springs and enjoy the active resort life. However, his real estate experience shows expertise in other areas. These include creation and sale of real estate tax-sheltered investment offerings, real estate management of high rises and garden apartment complexes, and development of raw land for construction of residential homes. In addition, for over 18 years he’s been building residential properties. He also has his certification as a Short Sale and Foreclosure Resource and most recently obtained his NJ Brokers license.
A truly dynamic duo
For some reason, these two diverse backgrounds meld together to form a productive, successful team. Charles and Ted have also been recipients of the Circle of Excellence Award multiple times between 2014 to 2017, which requires a minimum sales amount of $2.5 million and 15 transactions to qualify. And this second quarter, they did a combined $6,555,000 in sales volume. They don’t take winning this quarterly sales leader award for granted. Ted and Charlie know they were up against a highly motivated and knowledgeable group of sales associates. However, they also appreciate the friendship and camaraderie that exists within the New Jersey office. Most of all, it’s the unique system of training and support which ensures that everyone has the tools to provide the best possible customer service and experience.
And they’re looking forward to next year, wondering if they will be three for three second quarter 2019!
The July Housing Market Update was held live on Facebook on Tuesday, July 10, at 9 a.m. If you missed the live webinar, you can view it at your convenience by clicking here.
Meet the Panel
Geoff Green moderated the webinar and also presented relevant statistics in a historical context. Keren Gonen of Green Team Real Estate New Jersey conveyed the sales associate’s perspective on the housing market. Melissa Bressette, Green Team’s Marketing Director, rounded out the company’s participants. This month’s special panelists were Kevin Dolan, Branch Manager and Co-Director of Renovation and Construction Lending at Annie Mac Home Mortgage and Joe Panebianco, CEO of Annie Mac.
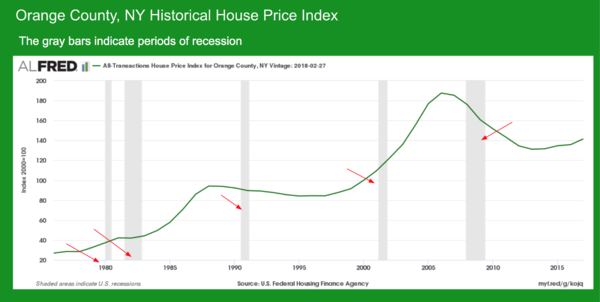
Orange County Historical House Price Index
Geoff presented a historical view of national and local prices, and a look at the market before, during and after recessions. In this chart of the Orange County, NY price index, gray bars indicate periods of recession. As shown in the graph, recessions don’t necessarily trigger downturns in the housing market. The inverse is usually true, with downturns in the housing market generally triggering recessions. Exceptions include the recession between 2000 and 2005. The housing market actually started to downturn around 2005, long before the financial collapse of 2008. Prices peaked in 2006, then continued to slide for over a decade. The steepness and duration of the curve is what is of special interest.
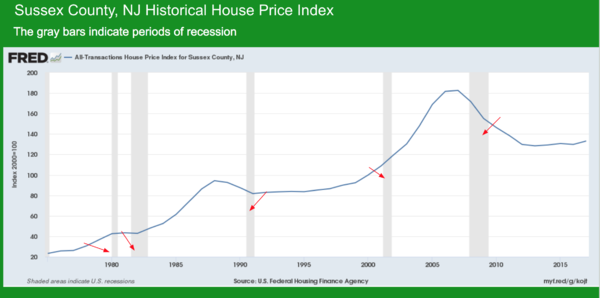
Sussex County NJ Historical House PriceIndex
In a historical context, the Sussex County and Orange County stats show a similarity, reflecting national trends.
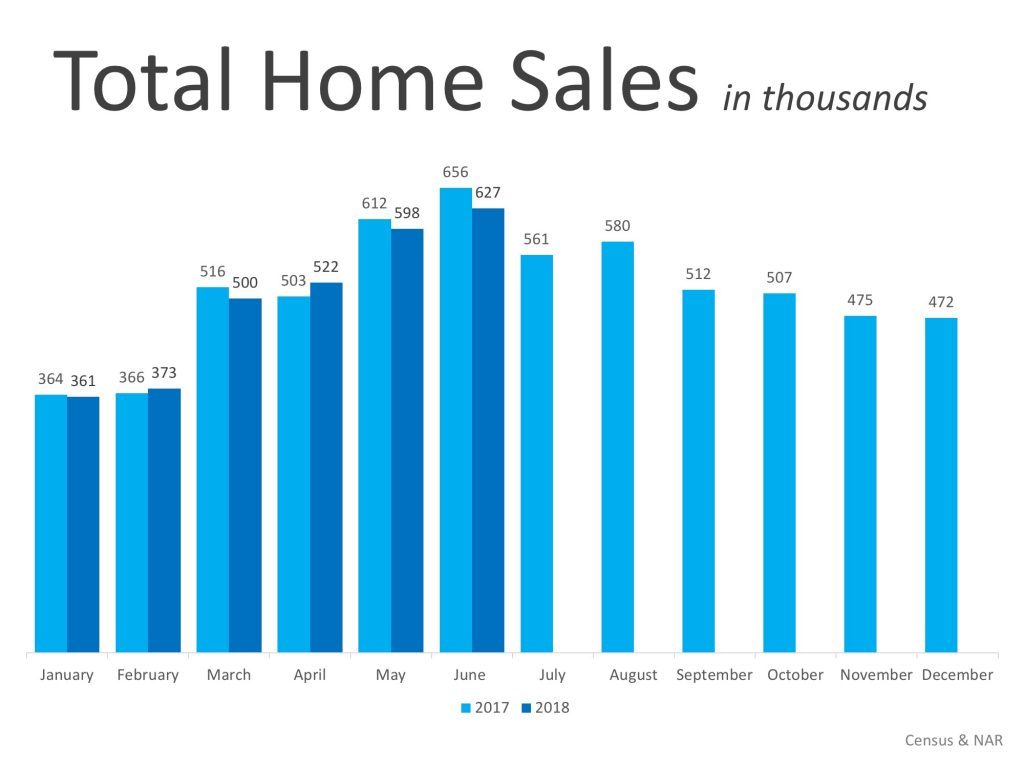
National Stats
In Total Home Sales in thousands there are no major increases in the year over year stats.
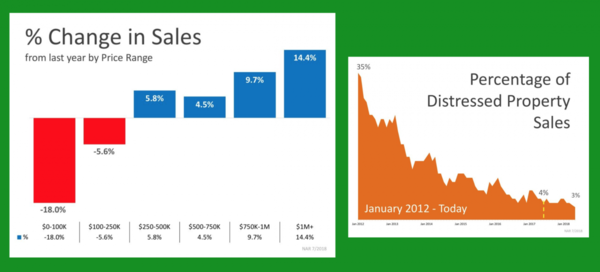
The number of houses available in lower price ranges is way down. However, there is an uptick in higher priced homes. Because of lack of inventory, buyers are being pushed into that higher price bracket.
The percentage of distressed properties for sale is way down from 2012.
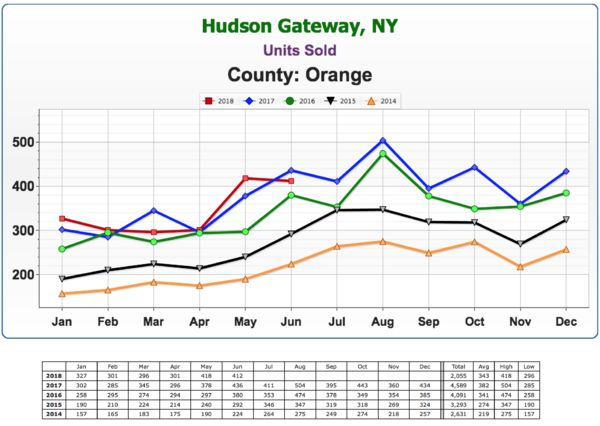
Orange County Market Stats for June 2018
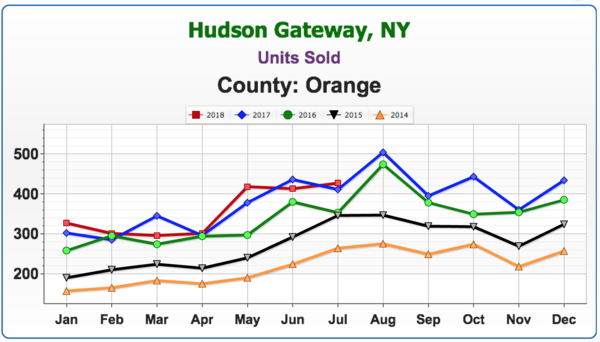
Units Sold
According to Geoff, this is one of the most important analytics in the housing market. No matter where pricing is, you can get an idea of the market by how many houses actually sold. There has been a great year over year increase for the past five years, but now it’s slowing down and we’re seeing a flattening now.
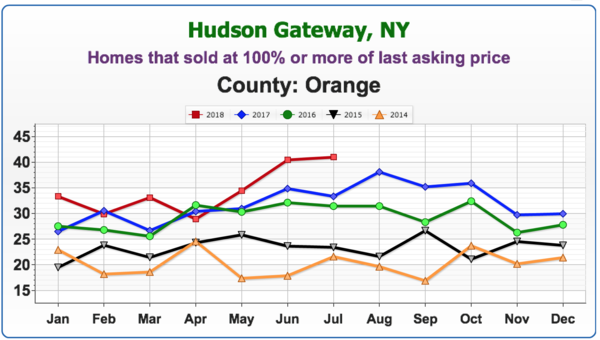
Homes that sold at 100% or more of last asking price
There’s a spike in this number. This is a hot market, and any home that is well located and in good condition will most likely have multiple offers at any one particular time. Basically, almost half of every listing on the market is being bid over asking. Note: Stats are based on last asking price, not original asking price.
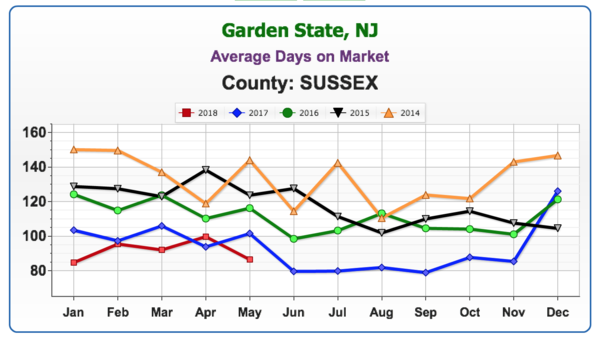
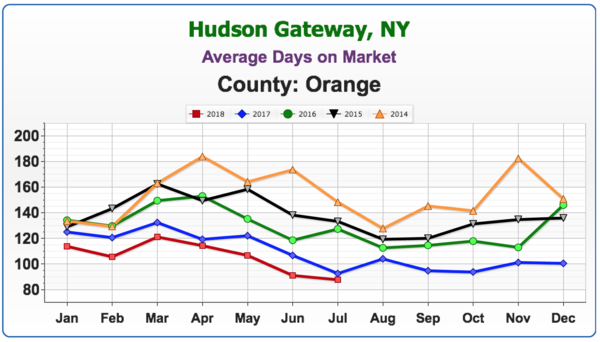
Average Days on Market
This number continues to decline, again showing a strong seller’s market.
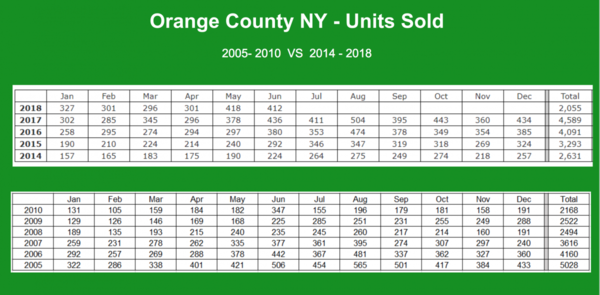
A Comparison of Units Sold from 2005-2010 versus 2014-2018
Geoff researched units sold in Orange County from 2005-2010 versus 2014-2018. Trends here follow National trends. The peak year was 2005 in terms of units sold. 2006 was the highest average home price the County has seen.. However, in 2010, the number of units sold had slid to almost half of the 2005 figure. Last year, we were above 2006 numbers, and close to 2005 in terms of units sold. Whether we’ll match or exceed that number in 2018 remains to be seen.
Recession
In a capitalist society, it is not a question as to whether or not there will be another recession. The question is when.
As defined in Merriam-Webster Dictionary, recession is “a period of temporary economic decline during which trade and industrial activity are reduced, generally identified by a fall in GDP in two successive quarters.” There is, of course, great interest in when the next recession will hit, and what impact it will have on the housing market.
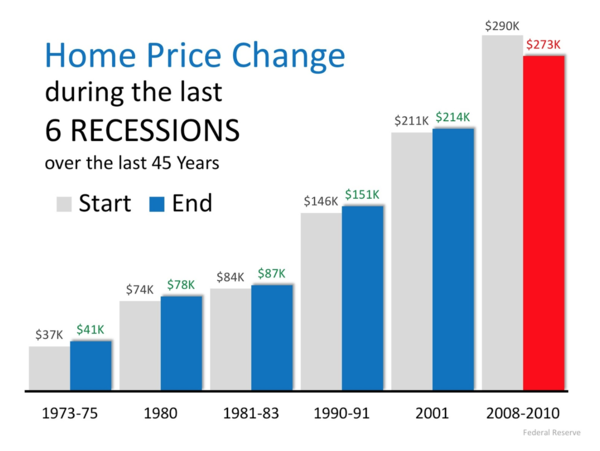
The graph shows home price changes during the last 6 recessions, over 45 years. The recession periods as designated by economists do not include the housing market downturns. Historically, prices haven’t been that affected during the recession; however, the definition of recession doesn’t include the whole downturn. And the real estate market takes time to recover.
‘
Keren Gonen’s perspective on the market from a sales associate’s point of view…
The market is very hot, in both Orange and Sussex Counties. In Warwick, if you don’t jump on a house right away, you can lose it. Keren is seeing bidding wars on homes within days of listing them.
When asked how long she thought the market would remain strong, she estimated about a year. One of the reasons we’re not seeing the lower priced homes sold, Keren indicated, was that banks that do have foreclosures are releasing them at much higher prices. Some banks are also renovating and flipping homes and charging even more.
Geoff commented that previously, when the market was really bad, there was shadow inventory. Banks would hold on to foreclosures, creating fear in the market that they would dump their inventory of low-priced homes, driving down prices. However, the banks seem to be changing their ways of doing things by renting out some homes, and fixing up others and selling them at higher prices.
The Mortgage Market – Where are we now?
Geoff stated that we’re definitely in an increasing rate environment and the Fed has signaled that they are going to continue to increase the overnight lending rates into the foreseeable future. Geoff asked Kevin Dolan to address where we are at now…
Kevin responded that where rates are concerned, they’re turning higher for the foreseeable future. Partly due to media coverage, people are starting to take the rise of interest rates and home prices seriously. They see continual coverage of higher rates on news shows. Thus, people are becoming proactive, buyers and sellers alike, driving productivity level.
Interest rates, inventory and recession. Oh my!
Joe Panebianco does economic analysis and strategy for Annie Mac. His expertise made him the perfect person to discuss specifics and timings of interest rates, inventory and recession.
Interest Rates: We will most likely be range bound from a 10-year treasury perspective from approximately 2.75 to 3.05 yield in the ten year. In other words, we’ll be relatively stable. Should this estimate be incorrect, Joe believes a slightly higher rise in interest rates will not significantly hurt the housing market. At some point, rates rising will have a deleterious effect and purchasers’ ability to afford a home may be impacted. However, we’re not at that point now.
Inflation and economic growth are the two primary components of interest rates. Inflation has remained stubbornly low and will most likely remain so. Hence, one reason why rates should remain relatively low. People talk about the Fed increasing rates, but they are increasing the short end of the curve.
As the Fed continues to hike rates, the result will be 10 and 30-year rates looking more like 2 and 5 year rates. Most of the duration of a mortgage-backed security is in a 7, 10 and 30-year part of the curve. And Joe believes that the more the Fed increases rates, the more likely we are to be in a recession and more likely to have lower, longer-term rates remain where they are or go lower. The mortgage market on Adjustable Rate Mortgages could be hurt because they’re much more likely to rise as they’re sensitive to the shorter end of the curve. 30-year fixed mortgages are more likely to stay in the aforementioned range.
The Global Connection
We live in a globally connected network and there is a yield spread between US 10-year Treasury bond and bonds in other countries, like Germany, Japan, Australia.. For central banks, very large institutions,etc., putting their money in US Treasuries provides a safer, purer investment over countries with significantly lower yields. However, regarding tariffs, trade wars are inherently bad for economies and may throw a curve ball into any predictions.
There are some who refer to our current economy as a “Goldilocks economy.” Not too hot, not too cold, just right… in some ways. The economy is growing enough to create jobs. And, according to Joe, jobs are far more important to home purchases than interest rates are. In the early 1980’s, interest rates were at 15% and yet homes were flying off the market. When rates go up, prices tend to come down. And there is always a buyer, especially if there is value to be had.
The history is if the Fed goes too far, it will drive the country into recession. Joe believes we have approximately 12 to 18 months left in this cycle. And that at the end of this period, we’ll be in a more normal market with a healthier balance between demand and sup
Factors that impact inventory
Labor, or lack thereof, is a major component. Many significant builders have unused land on their balance sheets, on hold because of the great recession of 2007 to 2010. About 70 to 75% capacity of the productive capacity of the home building industry was lost. Brick layers, sheet rockers, carpenters, plumbers, electricians, etc. – left the industry to seek employment in other fields. In addition, when major storms hit Texas, Florida, etc., many people in the industry picked up and went to work in those cities where they could make much more money. There are simply not enough craftsmen and laborer to build all the homes necessary to meet current need.
Municipal Fees, laws – Fees, regulations, etc., have made building a home both difficult and expensive. To help increase taxable base, some municipalities are now trying to make things a little easier for those seeking to build new construction.
Tariffs – The “War of Words” regarding trade with Canada is not good news for the housing industry. A disproportionate share of home building lumber comes from Canada, and price of lumber futures has already risen on expectation of tariffs.
Easing of Credit
In the next 12 months, we may see easing of some requirements. At this time, no one knows how this will be done. However, some options might include reducing Mortgage Insurance on the FHA side, especially for first-time buyers. Also, Freddie Mac might follow Fannie Mae’s lead in reducing Long Term Debt and Debt to Income Ratio. Average renters spends 50-55% on rent. However, the current Debt To Income ratio is in the low 40’s for purchases. There might be a move to update the DTI.
Demand is not going to Cease
According to Joe, by 2025 there will be approximately 10 million new household formations. 35% will be from millenials, 35-40% from among the Hispanic community (with some overlap between the two), and 10% from the African-American community. Many of these new home buyers will be DTI (Debt to Income Ratio) challenged. They will need the services of qualified real estate agents, knowledgeable mortgage specialists/
Geoff pointed out that purchase and rental markets are both hot at the same time. This indicates a true housing shortage. The Millennial population seems to be exceeding Baby Boomers. Pent up demand and limited supply serve to elongate and stretch out the cycle.
Home ownership improves communities – and the economy
Home ownership lends itself to not only building communities, but also to building up business, including home improvement and furniture stores, furniture stores, durable goods vendors, etc., etc.- all of which will help the economy. Inventory may become less of an issue month by month by month.
Renovation Loans
Kevin Dolan is an expert in renovation loans. There are homes on the market that just won’t sell because they are not in good shape. He believes the renovation lending program is under-utilized simply because it is not understood and there are many misconceptions.
There are two types of renovation loan programs – conventional and FHA. This opens up versatility for buyers as to who it can serve, such as a down payment as low as 3-1/2%. It also allows for lower credit scores. These loans can be utilized for primary homes, second homes and investment properties. The loan allows for someone to buy a house in need of repair, and have an approved, qualified contractor bid on work to be done. Depending on scope of work, sometimes a HUD consultant will make sure prices quoted for the work are appropriate. The renovation funds goes into an escrow account, and contractor has specified time to do improvements, usually within six months. The bank pays contractor directly. The process is streamlined and efficient.
Kevin feels that educating buyers and real estate agents alike is key to opening up this market. Keren agreed, stating that she often does sell homes by telling buyers that renovation loans are available, and explaining how they work. It opens up options and vision for the buyers who cannot afford to buy a home in the $300-$400,000 range. Annie Mac does have a certification program available for real estate agents who would like to become expert in this area.
Renovation loans – not just for buyers
Kevin commented that renovation loans can also be helpful for sellers who need to update their homes in order to sell. By adding another bath or more bedrooms, the value of the home can be increased so that the seller can pay off existing mortgage and closing costs, and hopefully make a profit as well. Also, from Seller’s position, if they have a failed septic tank, they can sell the home at a lower price and buyer can get a renovation loan to cover the cost of having the work done themselves.
Joe added that in looking to build wealth in addition to creating a home for their family, renovations can help improve their property, and therefore their investment.
Geoff spoke about the importance of finding someone who truly understands these loans as they can be tricky for the loan originator. Geoff spoke highly of Annie Mac, not just for renovation loans, but for all financing needs.
Stay tuned for the next market update
The next update is August 14, 2018 at 9 a.m. You can sign up at GreenTeamHQ.com/HMU
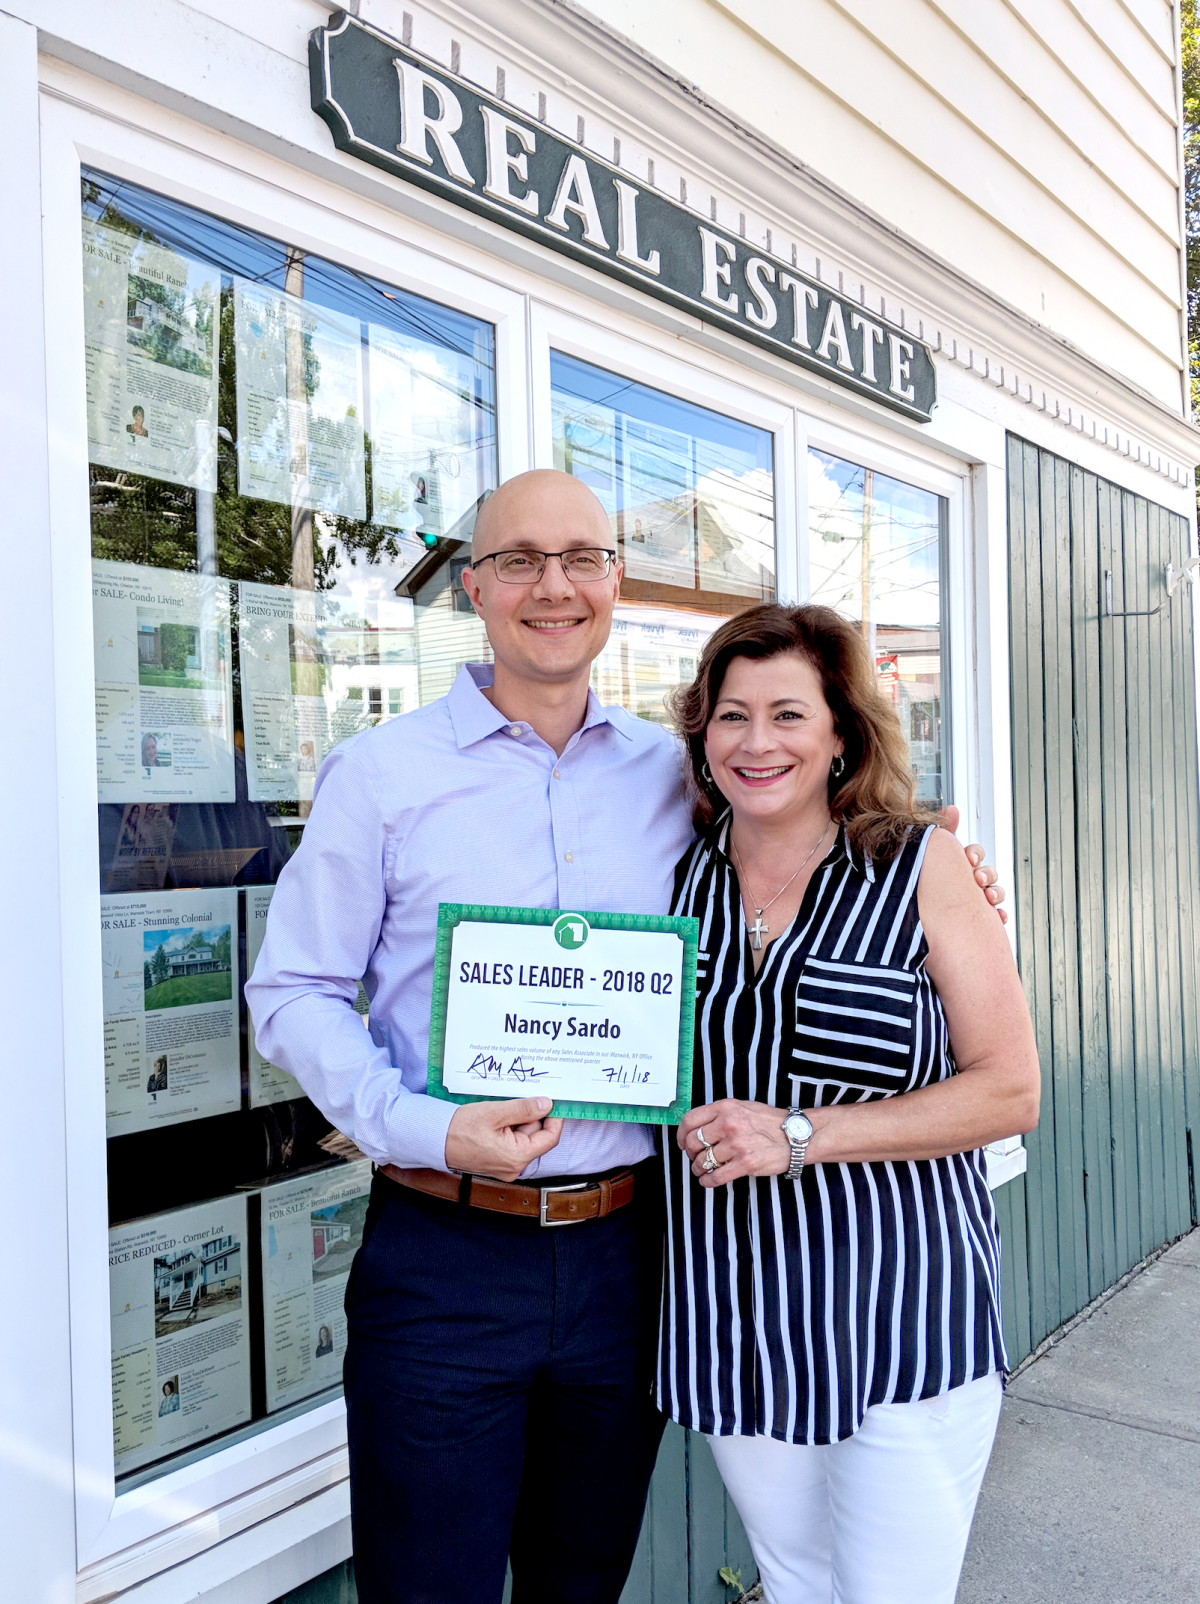
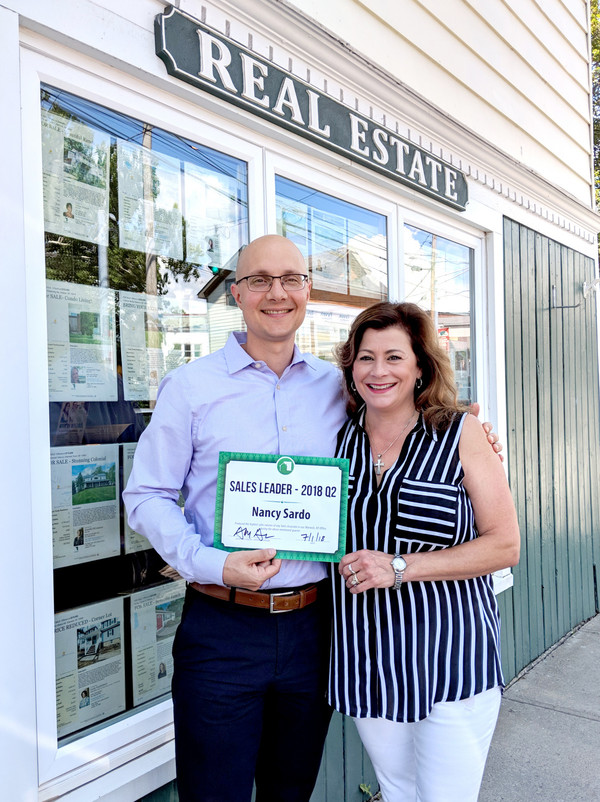
The Green Team is pleased to announce that Nancy Sardo is the Sales Leader Award Winner for both the First and Second Quarters of 2018. Nancy is not a stranger to this achievement. In 2017 she was the winner for the Second and Third Quarters. And some things just don’t change. Nancy still does not want to talk about herself. Instead, she would prefer to talk about the Green Team and the support and training offered.
A Mutual Admiration Society
When Nancy and Geoff Green talk about each other, their mutual admiration is evident. Nancy is proud to be with a broker who is constantly on the cutting edge of technology He provides Green Team sales sssociates with the marketing tools, technical training and practice sessions they need to provide the utmost in client service.
Nancy finds the Green Team Home Selling System to be unsurpassed when it comes to providing education, training and support. And, whether an agent is new or seasoned, Geoff always makes time to talk and brainstorm a problem. He may not know this, but he inspires Nancy to get out there and do her best everyday.
And Geoff’s thoughts on Nancy? He takes great pride and joy in all of her successes. He has called her a true superstar, and that description continues to hold true, maybe now more than ever.
It Takes a Team
One of the reasons Nancy doesn’t like to talk about herself is that she believes it takes more than one person to properly market a property or create a presentation to a perspective client. The team approach is a major part of the Green Team’s way of doing business. Geoff makes sure that his sales associates are backed up by a talented support team: office support, marketing director, graphic designer, copywriter, and computer specialists.
Being in the business of listing and selling homes throughout Orange County since 2005, Nancy has seen the positive impact of the Green Team’s approach as opposed to other brokerages. The emphasis on exceptional service and client appreciation has made a very real difference in her business.
New Construction: Combining passion and expertise
Nancy enjoys real estate in all its forms, whether helping someone buy, sell, or lease a property. However, her real passion is new construction. She has extensive experience working with both builders and clients. Her experience has led her to serve as listing broker for many subdivisions throughout Orange County. Nancy keeps up-to-date on new building codes and their impact on current and planned building designs and costs.
Nancy walks the buyer through all the steps of building their dream home. From the first meeting with the builder, obtaining financing, selecting finishes and upgrades and making sure that decisions are made in a timely manner to meet construction schedules, Nancy is there. Her goal is to make the experience of building a home as positive and stress-free as possible. And she keeps costs in mind as she guides buyers through the process, doing her best to keep them on their budget and not overspend on finishes and options.
The Whole Package…
With a shortage of existing homes on the market, new construction offers an option that might not have been previously considered. If you choose this route, being represented by a sales associate with knowledge, experience, an eye for detail, and the ability to keep track of and explain the process is priceless.
Nancy Sardo has all those qualities and more. Her real estate credentials are impressive. She’s an Accredited Buyer’s Representative (ABR), earned her Associate Broker’s License, and also has the Seniors Real Estate designation (SRES). She works non-stop and is constantly in motion. But there is something else about Nancy that makes her stand out and helps explain her success. Even in the midst of difficult times, she remembers to look for the good. Combine her knowledge, expertise, and energy with a remarkable attitude and you know that Nancy is, indeed, the whole package.
Orange & Sussex Counties – Housing Market Update for June 2018 and Impact of Federal Tax Reform on the Housing Market
The Green Team went live on Facebook Tuesday, June 12 with its monthly housing market update. Geoff Green, President of the Green Team, moderated the event. Panelists included sales associates Vikki Garby and Kim Leslie of the Warwick office and Keren Gonen and Joyce Rogers from the Vernon Office. Guest panelists were Dan Bounds, Senior Home-Lending Advisor with Chase Bank and Ed Mainland, Executive Director at JP Morgan Chase & Co. A special presentation was given by Thomas McGlynn, Managing Director of BDO Expatriate Services, on the impact of federal tax reform on the housing market.
Overview
Nationally there has been a 5.3% year-over-year increase in existing home prices. Low to middle-level houses are moving faster than higher-end homes. However, economists are concerned about the affordability of homes for the entry buyer level. The lack of inventory is driving home prices up. The West Coast has been moving at a greater pace than here in the North East. Supply and demand is taking hold. Foot traffic stats are very interesting. There has been more foot traffic this year than last year during the same time. On a national level, existing home sales are slightly down from where they were last year during the same period. This may be a reflection of inventory problems.
Orange County Update
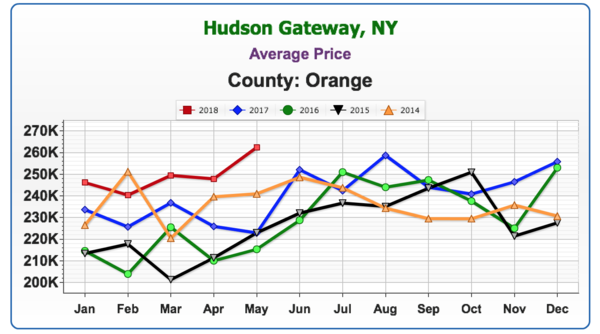
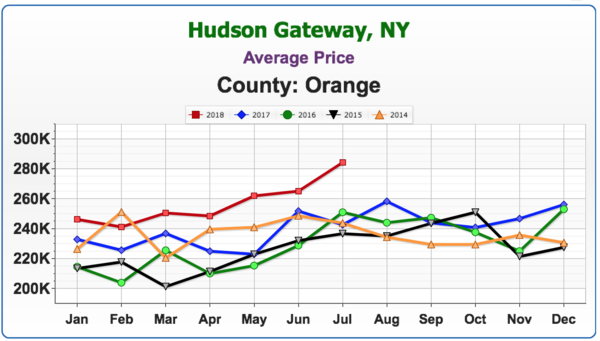
Average Price
Average price has really taken off. There was a mixed bag of results until this year.
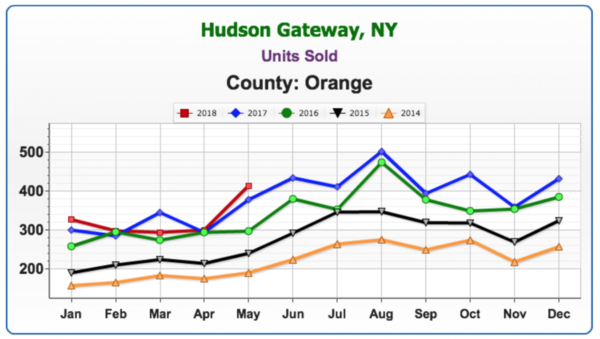
Units Sold
May saw the most units sold for this month since 2014. However, prior to May, this year is the first where we’ve seen more than one month at or less than the same month in previous years. There has been a steady increase year-over-year until 2018. We will continue to keep a watch on this analytic as it may be the most important indicator of when there will be a downturn.
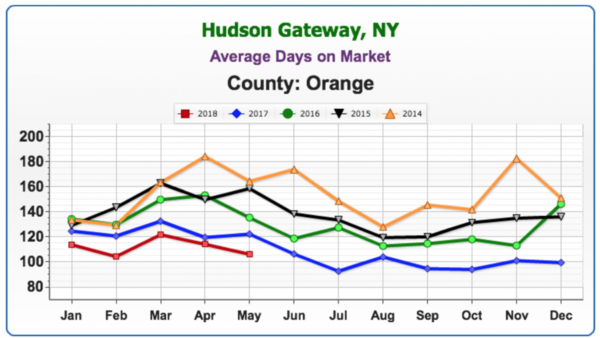
Average Days on Market
The average days on market continues to decrease. This indicates the market is hot; a good seller’s market. For some who have been waiting a long time, now may be a good opportunity to sell their homes.
Sussex County Update
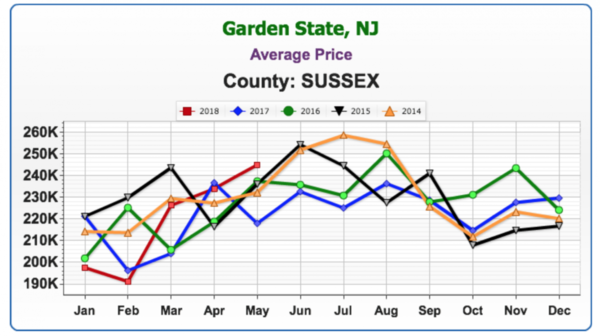
Average Price
The amount of distressed inventory (foreclosures, short sales, etc.) has stymied price growth and appreciation in Sussex. However, the average price in May of this year is the highest it has been for this month since 2014.
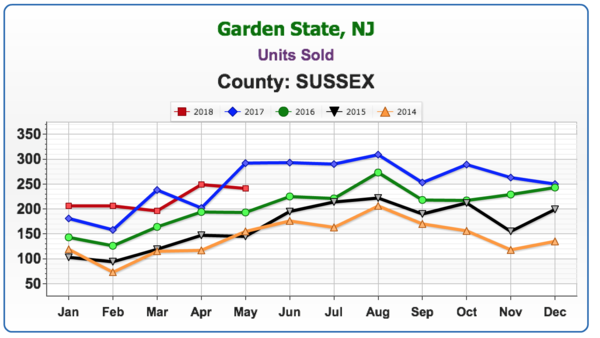
Units Sold.
There has been a substantial decrease in units sold, even with average price increasing and average days on market decreasing.
Average Days on Market
The average days on market keeps going down, indicating a hot market.
Market Q&A
Buyer Concerns – Price or Inventory?
Geoff Green asked Vikki Garby whether she got a sense that her buyers were more worried about current prices or not being able to find a home due to lack of inventory. Vikki responded that inventory was the biggest problem. However, once they found a home, buyers were concerned about going to contract quickly. People were getting stressed out about interest rates. Therefore, they want to get them locked in as soon as possible since rates are rising. Dan Bounds advised that their mortgage customers are able to get their rate locked in once they have a signed one-page purchase agreement.
Appraisals – On Point?
Geoff then asked Keren Goren if appraisals were coming in on point, or if there were still problems. Keren replied that appraisers were coming in on point in New Jersey. Geoff responded that in a solid, appreciated market appraisers seem to be more comfortable and confident coming in on valuation.
Inventory – Quality or Quantity?
Geoff’s question to Joyce was, “Everyone says there’s no inventory, but there are homes on the market. Is the physical nature of inventory not what buyers are looking for? Is it the condition of homes?” Joyce stated that there was not a lot in good shape in certain price points. Much is a total gut job. Buyers want what they want, and many don’t see the potential in getting a fixer-upper.
Geoff felt that money, time and ability can be a deciding factor. In addition, as a property owner himself, he knows how hard it can be to get good contractors. They’re busy, materials are costing more, and prices are coming up. Both Joyce and Keren said that they’ve seen flippers making mistakes and poor choices that are visible to buyers. Using lower grade materials, not putting finishing touches (outlets without covers, exposed wiring, etc.), they are hurting themselves in their rush to put the house on the market. The problem is then compounded by listing agents overpricing these homes.
The Luxury Home Market
There has been discussion about possible negative impact of the new tax laws on the luxury, hi-end real estate market. While too soon to know what the true impact will be, the luxury market is currently doing better on a year-over-year basis. Sales of high-end homes ($500-$750,000) are up in both Orange and Sussex Counties.
The Impact of Tax Reform on the Housing Market
Following the monthly market update, guest speaker Tom McGlynn of BDO spoke about the impact of tax reform on the Housing Market, as well as in general. The Tax Cuts and Jobs Act was signed on Dec 22, 2017, the President’s “gift” to the nation. There wasn’t time to process the impact as changes began Jan 1, 2018. The Legislation will expire for individuals on Dec 31, 2025.
Tax Rates for 2018
It had been expected that tax rates would be limited to 3 or 4 bands. However, the bands are dramatically expanded. Furthermore, there is a drop in rates from a high of 39.6% to a high of 37% in 2018, going forward. The expectation is that people with higher income levels will see a decrease in federal income tax liability.
Major Changes:
Above-the-line deductions:
Moving expense deductions: Only available for US military moving pursuant to military order. As a result, changes will impact US citizens who move for employment, whether in the US, abroad, or to the US.
Alimony: For Agreements entered into after Dec 31, 2018. the deduction for alimony or separate maintenance payments has been repealed. Furthermore, inclusion of money received for alimony as income is repealed. Existing agreements are grandfathered in.
Standard & personal exemptions: Standard deduction increased, almost doubled. Married filing jointly, is now $24,000. More taxpayers may end up claiming the standard as opposed to itemizing. Personal exemption is suspended through 2025.
Medical Expenses. Threshhold lowered to 7.5 percent from 10% for out-of-pocket expenses not covered by insurance.
Real Estate impacted regulations
State and local taxes: In our market this is the big item. Taxpayers are now only allowed to deduct a maximum $10,000 aggregate of state and local real property, personal property, and state and local income sales taxes.
Mortgage Interest: Amount of acquisition indebtedness applies to new loans. However, mortgages in place before 2017 grandfathered in up to $1,000,000 mortgage. For debt incurred after Dec 15, 2017, you can only deduct interest paid on indebtedness of up to $750,000. Furthermore, home equity interest deduction has been suspended.
Vikki asked for confirmation that limitations do not apply to real property taxes and personal property taxes paid or accrued in carrying on trade or business? Tom confirmed that this is correct; real estate traders/investors filing Schedule E are not subject to the new limits. In addition, properties held for investment are not effected by the mortgage limitation.
Changes in other deductions
Charitable contributions: Limitation on deduction for cash contributions increased to 60% of AGI. However, this cannot be in addition to Standard deduction. The deduction can only be taken if the taxpayer is itemizing. It is not known how or if this will affect charitable giving.
Casualty losses: Suspended through 2025, unless loss is attributable to a Federally declared disaster area.
Wagering Transactions: Limited to income offsetting expenses.
Miscellaneous itemized deductions: Suspended through 2025. Includes unreimbursed business expenses, investment fees, tax prep fees.
Pease limitation suspends limitation on itemized deductions. For 2018-2025, no limitation on itemizations exceeding standard deduction.
AMT (Alternative Minimum Tax): Put in place to make sure taxpayers weren’t able to reduce their tax liability by utilizing certain itemized deductions (income taxes, real property, state and local taxes) due to income. Congress minimized Corporate AMT. The individual AMT was expected to be eliminated. However, Congress decided to keep it in place but significantly increased exemption amounts and thresholds.
Selling Your Home – Tax Basics Relating to Closing Disclosure Statement
Nothing changes regarding home sale rules if you can show you owned and used home for principal use 2 out of 5 years. Hence, the first $500,000 of gain is exempt from federal and state tax. Basis is the amount home is worth for tax purposes. This includes what you paid for home, improvements, closing costs, etc. However, current year deductions may be subject to limitations.
The above are just highlights of the discussions and presentation. You can watch the entire video here.
We Keep You Informed:
The Green Team Shares this information and more each month during our Live Housing Market Update. Register to join the webinar and hear directly from our participating Green Team Sales Associates who share their personal take on how the marketplace is doing.
Industry experts join us each month to share insights into the currently financing environment, as well as broader economic issues affecting the housing market.
Check out our past Housing Market Updates. Then Register to get our Housing Market Updates.
In today’s housing market, where supply is very low and demand is very high, home values are increasing rapidly. Many experts are projecting that home values could appreciate by another 5% (or more) over the next twelve months. One major challenge in such a market is the bank appraisal.
When prices are surging, it is difficult for appraisers to find adequate, comparable sales (similar houses in the same neighborhood that recently closed) to defend the selling price when performing the appraisal for the bank.
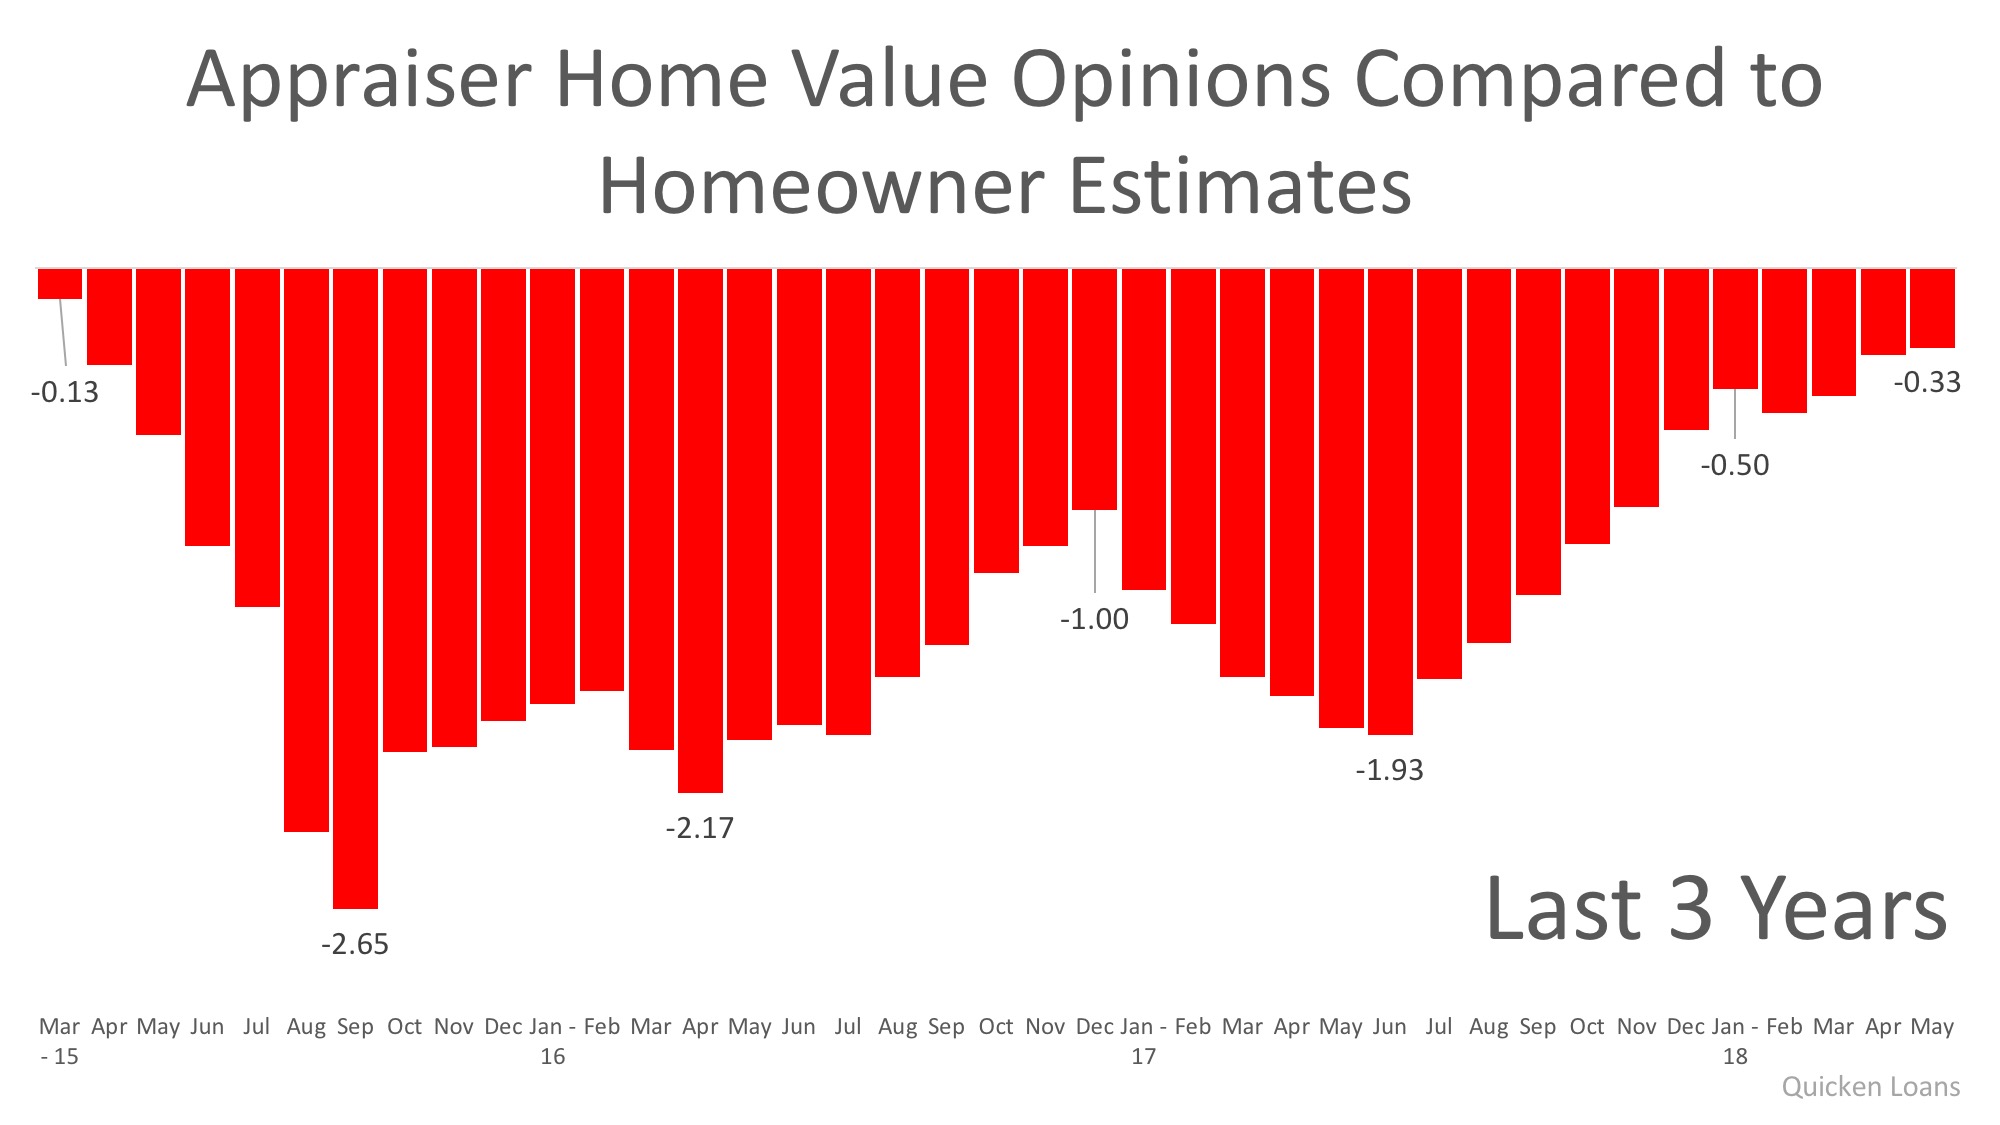
Every month in their Home Price Perception Index (HPPI),Quicken Loans measures the disparity between what a homeowner who is seeking to refinance their home believes their house is worth and what an appraiser’s evaluation of that same home is.
March 2015 marked the first month of a three-year gap between what an appraiser and a homeowner believed a home was worth. That gap widened to 2.65% in September 2015 and had consistently hovered between 1.0% and 2.0% through November 2017.
The chart below illustrates the changes in home price estimates over the last three years:
In the latest release, the disparity was the narrowest it has been since March 2015, as the gap between appraisers and homeowners was only -0.33%. This is important for homeowners to note as even a .33% difference in appraisal could equate to thousands of dollars that a buyer or seller has to come up with at closing (depending on the price of the home).
Bill Banfield, Executive VP of Capital Markets at Quicken Loans urges homeowners to find out how their local markets have been impacted by supply and demand:
“The appraisal is one of the most important, although sometimes least predictable, parts of the mortgage process. The Home Price Perception Index is a way to illustrate the differences of opinion, and these differences affect everything from the type of mortgage a borrower can get to the expectations a seller has about the proceeds available upon sale of their home.”
Bottom Line
Every house on the market must be sold twice; once to a prospective buyer and then again to the bank (through the bank’s appraisal). With escalating prices, the second sale may be even more difficult than the first. If you are planning on entering the housing market this year, let’s get together to discuss this and any other obstacles that may arise.


 Facebook
 X
X
 Pinterest
 Copy Link


 The
The