

 Facebook
 X
X
 Pinterest
 Copy Link
Orange County Real Estate Market Report for April 2018
Green Team Business Review – April 2018
There has been a lot of excitement at the Green Team lately. Much of it was generated by the Launch Competition, which was a tremendous success this year. You can read about this annual contest, its goals, the winners and the prizes here. Then Lucyann Tinnirello was selected as the new Broker Manager of the Warwick office. In addition, Nancy Sardo was named the recipient of the First Quarter Sales Leader Award in Warwick.
Making Market Updates More Informative and More Accessible
While it seems that would be enough to report, there’s more. The Green Team strives to bring its agents and its clients up-to-date market information as well as insight into the mortgage market, events that impact interest rates, and more. To provide all this information in an expanded, far-reaching format, the Green Team is going Live on Facebook.
Orange County, NY Real Estate Market Report – March 2018 Results
We are pleased to share with you the Housing Market Report for March 2018. We break down local real estate activities and provide you with stats, graphs, and analysis of our local and regional real estate market. The April Market Update was held Tuesday, April 17 on Facebook Live. It was moderated by Geoff Green, the Broker/Manager of Green Team Home Selling System. Panelists included sales agents Vikki Garby and Jacqueline Kraszewski. In addition, Jeremy Miller of First Home Bank provided insights on mortgage and housing industry stats. Dan Habib, of MBS Highway, a firm that provides insight and analytics to industries, discussed where interest rates are headed and the topic of affordability. Watch the video on our Facebook page to hear what these experts had to share.
Also, you can sign up on the Green Team website to receive a monthly update by email.
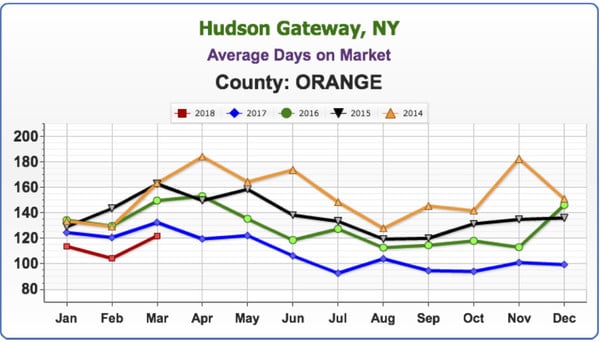
Average Days on the Market
The faster homes are selling, the hotter the market. Look for the lowest number on the graph, as opposed to the highest. The calculation in New York State is from the List Date to the Contract Date.
We take a snapshot of the past 5 years and see how the current market compares. The average number of days on the market is the lowest it’s been for March since 2014. This shows a stronger market for sellers. However, it’s not the best news for buyers.
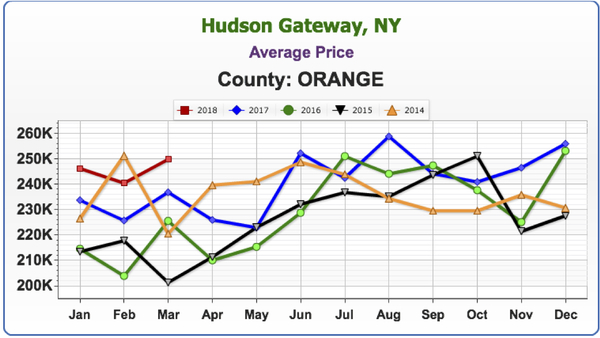
Average Price
Prices have not been on the comeback for some time, but last June they started to rise and are now coming out of the gate significantly higher. According to Geoff, inventory continues to be a big problem. He thinks that one of the issues is that some sellers still can’t get out of their homes based on refinancing they did ten years ago. They just can’t sell until prices rise, and he believes that will be the key to unlocking inventory.
Jacqueline stated there are just not enough houses out there to show. The average length of time that most people stay in a house is ten years, and ten years ago was when the market really crashed. Some people are still underwater and either can’t get out, or don’t want to just break even; they’d like to make a profit.
Vikki added that this year some things are helping. Last year appraisals were hurting the market. This year they seem to be getting more realistic based on what is actually happening in the market. There is very little supply for the demand. Market traffic was higher in February 2018 than it was in May of 2017. Sellers are feeling their strength and power in this market. Even banks are seeing the market potential and wanting to get in on the act, raising prices on properties they would have sold at much lower prices in previous markets. Vikki has experience in real estate investing, flipping homes, etc., so she brings a valuable perspective to the conversation.
Geoff mentioned that some banks are even holding their position in inventory and renting out units, something which is highly unusual. Banks generally unload inventory. For them to hold and rent is almost unheard of.
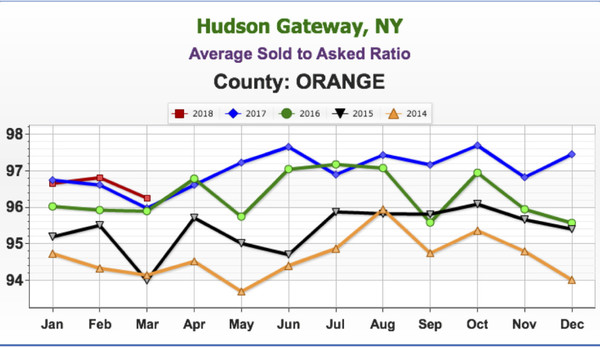
Average Sold to Asked Ratio
The percentage a house sold for under or over the last asking price (not the original price).
The higher the percentage, the hotter the market. Again, March 2018 is outpacing the last 4 years, with sellers negotiating approximately 3.5 points off their last asking price. It’s important to remember that this is an average of all Orange County; in some areas the percentage will be higher and in others, lower.
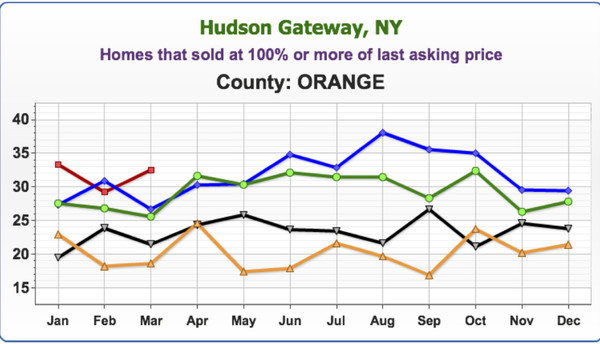
Homes that sold at 100% or more of last asking price
Again, the numbers continue to rise. March 2018 is the highest it’s been since 2014, with almost 35% of homes going for 100% or more of the last asking price. In other words, expect bidding wars!
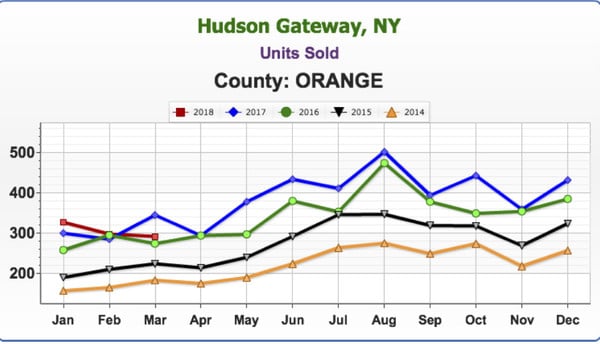
Units Sold
There hasn’t been a dip from the previous year in many years. However less homes were sold in March than in previous years. Vikki felt that people closing in March were closing on those deals made in December and January, when inventory was way down.
Jacque stated that the market is hard on people starting out, those buyers in the under $300,000 range. There is not much available at that price point, and if there is something, it’s usually a total handyman special, which people don’t want!
Geoff agreed that currently, couples are usually both employed and don’t have the time, expertise or inclination to start making repairs and remodels to the home they purchase. They would rather pay top dollar for a move-in-ready home. His advice for sellers: spend time renovating your home before putting in on the market. Bathrooms, kitchens, windows all need to be in good shape. Paint, new siding, fixing up the landscaping, and replacing the roof if necessary, will bring a good return on your investment. Buyers are willing to pay top dollar!
Next Market Update
Mark your calendars and join us on Tuesday, May 8 at 9:15 a.m. for our next Facebook Live Market Update. Our special guests will be Michael Giannetto of Residential Home Financing, who will be offering substantive updates on the mortgage market and Ken Ford of Warwick Valley Financial Advisors, who will discuss other economic factors impacting the housing market. If you can’t make it at 9:15, be sure to watch it later!
Are You Aware of How Much Equity You Have in Your Home? You May Be Surprised!


CoreLogic’s latest Equity Report revealed that 675,000 US homeowners regained positive equity in their homes in 2017. This is great news for the country, as 95.1% of all mortgaged properties are now in a positive equity situation.
“U.S homeowners with mortgages (roughly 63% of all the properties) have seen their equity increase by a total of $908.4 billion since the fourth quarter 2016, an increase of 12.2%, year over year.”
Price Appreciation = Good News for Homeowners
Frank Nothaft, CoreLogic’s Chief Economist, explains:
“Home-price growth has been the primary driver of home-equity wealth creation. The CoreLogic Home Price Index grew 6.2 percent during 2017. The largest calendar-year increase since 2013. Likewise, the average growth in home equity was more than $15,000 during 2017, the most in four years.”
He also believes this is a great sign for the market in 2018, saying:
“Because wealth gains spur additional consumer purchases, the rise in home-equity wealth during 2017 should add more than $50 billion to U.S. consumption spending over the next two to three years.”
This is great news for homeowners! But, do they realize that their equity position has changed?
A study by Fannie Mae suggests that many homeowners are not aware that they have regained equity in their homes as their investment has increased in value. For example, their study showed that 23% of Americans still believe their home is in a negative equity position when, in actuality, CoreLogic’s report shows that only 4.9% of homes are in that position (down from 6.3% in Q4 2016).
The study also revealed that only 37% of Americans believe that they have “significant equity” (greater than 20%) when in actuality, 83% do!

This means that 46% of Americans with a mortgage fail to realize the opportune situation they are in. With a sizeable equity position, many homeowners could easily move into a house (either larger or smaller) that better meets their current needs.
Fannie Mae spoke out on this issue in their report:
“Homeowners who underestimate their homes’ values not only underestimate their home equity, they also likely underestimate 1) how large a down payment they could make with their home equity, 2) their chances of qualifying for mortgages, and, therefore, 3) their opportunities for selling their current homes and for buying different homes.”
Bottom Line
If you are one of the many Americans who is unsure of how much equity you have built in your home, don’t let that be the reason you fail to move on to your dream home in 2018! Let’s get together to evaluate your situation!
Do You Know the Cost of Waiting? [INFOGRAPHIC]
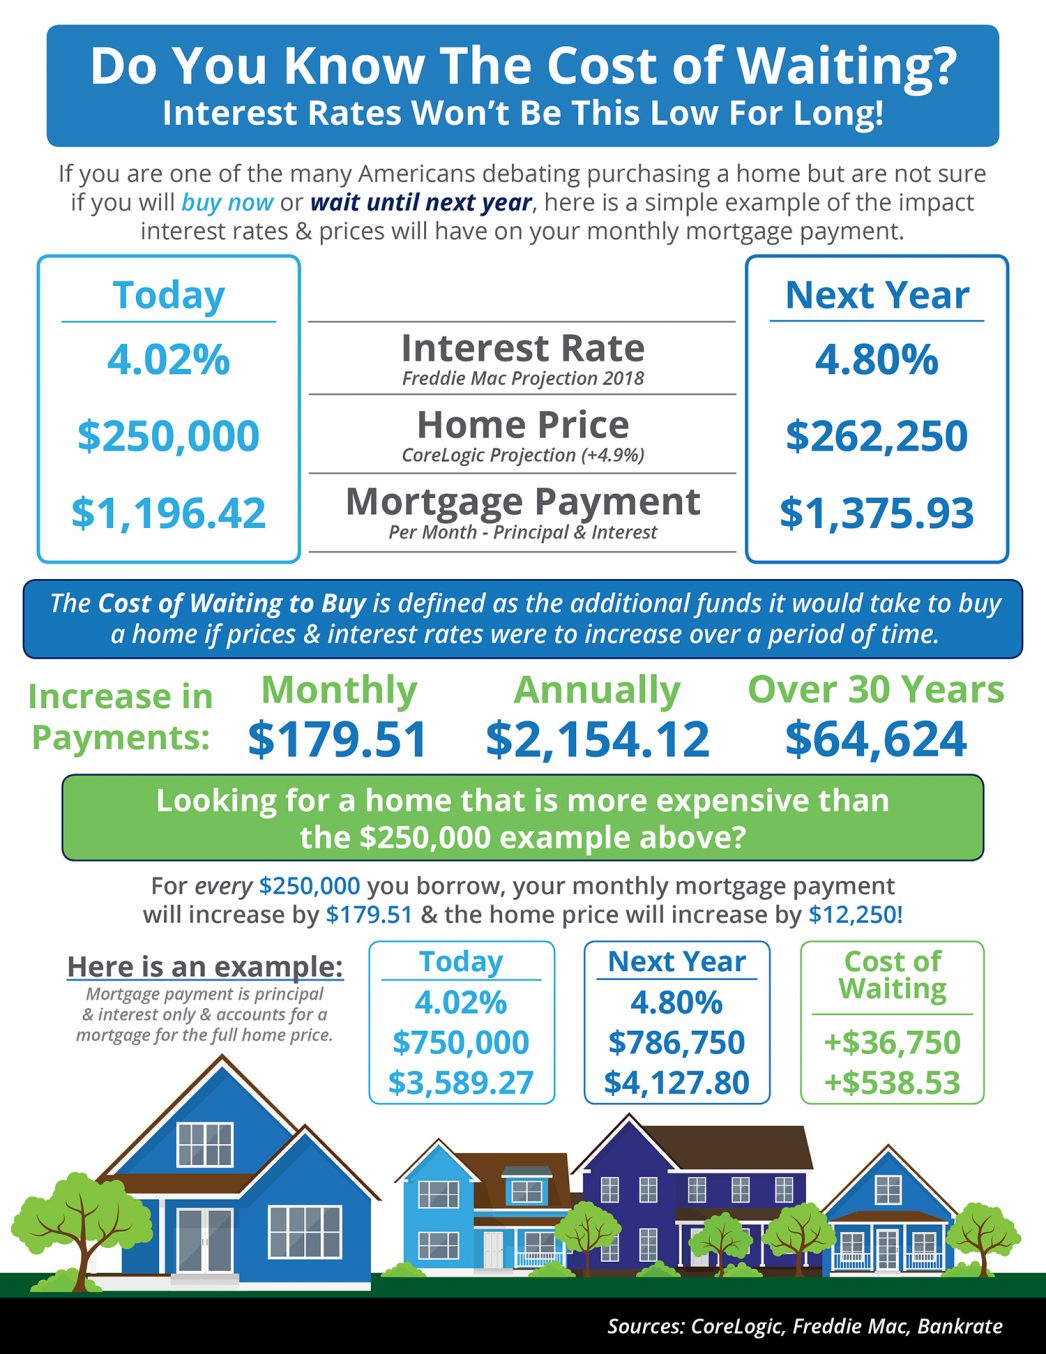

Some Highlights:
- The “Cost of Waiting to Buy” is defined as the additional funds it would take to buy a home if prices and interest rates were to increase over a period of time.
- Freddie Mac predicts that interest rates will increase to 4.8% by this time next year, while home prices are predicted to appreciate by 4.9% according to CoreLogic.
- Waiting until next year to buy could cost you thousands of dollars a year for the life of your mortgage!


