Green Team’s Real Estate Market Overview
2017 – A Year of Growth and Success
The last Real Estate Market Review Meeting of 2017 marks a year of growth and success on both company-wide and individual levels. In both the Warwick and Vernon offices, many sales associates have met or exceeded the goals they set at the beginning of the year. Many of the agents in Warwick doubled their sales from last year, including Nancy Sardo, Vikki Garby, Tammy Scotto, Angela Murphy, Chris Kimiecik, Julianna Green and Jane Reilly. As the Vernon office opened this year, there are no numbers from 2016 to compare to. However, the New Jersey sales associates are setting the bar high for next year. Eight agents had sales exceeding $1 million – and some exceeding $4 million! Keren Goren, Charles Nagy, Barbara Tesa, Ted Van Laar, Joyce Rogers, Heidi Hyland, Stacy Springerand Kimberly Lasalandra will have to set their goals high for 2018 to compare with their sales this year.
The Importance of setting goals
The numbers from December won’t be available until next month, but projections look very good and once the final numbers are in and tallied with the year to date numbers, award winners will be determined. The excitement builds! Will Jennifer DiCostanzo, winner of 2016’s Sale Leader Award take the prize again this year for the Warwick office? Will Keren Goren, a highly motivated newcomer to real estate, take the prize for the Vernon office? Stay tuned…
The Green Team Annual Award Ceremony will take place on January 26, and Fourth Quarter Sales Leader Awards and Sales Leader Award for 2017 will be announced. All of the agents who have become Quarter Sales Leaders and Sales Leaders for the Year have been goal setters. According to Geoff Green, the importance of the Personal Action & Engagement Plan for 2018 cannot be overstated and he encourages all Green Team agents to complete and submit theirs and start the New Year on the right note!
How is the market?
It is imperative that agents understand how to analyze local real estate stats and be able to provide a clear and accurate portrait of market conditions to their clients. Fluctuations from month to month may seem minor, but tracking them throughout the year gives a good indication of where the market stands. Trends towards a sellers or buyers market will affect advice to clients, whether they are buying or selling a home. The importance of this information is why a monthly meeting is held to go over the previous month’s statistics and overall trends for the year.
Local Market Reports – Sussex County, NJ
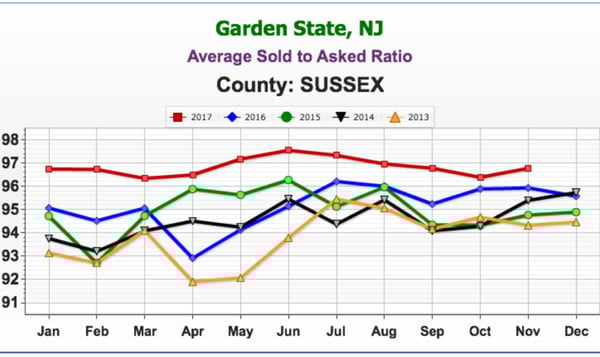
Average Sold to Asked Ratio
The percentage a house sold for under or over the last asking price (not the original price).
Sussex County: There was an increase in the Average Sold to Asked Ratio from October to November, from 96.38% to 96.76%, continuing the trend of 2017 being higher than any of the previous four years.
Units Sold
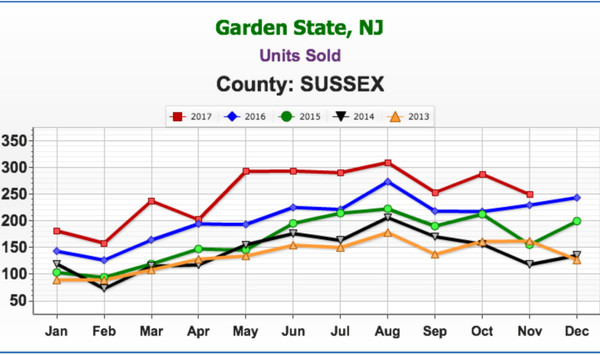
The term units here includes single family homes, condominiums, town homes and multi-family homes with 1-4 units.
Sussex County: The stats show that the market continues to be hot, with more units being sold this year than in any of the years from 2013 to 2016. While there was a rise in units sold from September to October, there was a slight dip in units sold in November. Even with that dip, the number of units sold this November is higher than the number of units sold in the same month in each of 2013, 2014, 2015 and 2016.
Average Days on Market
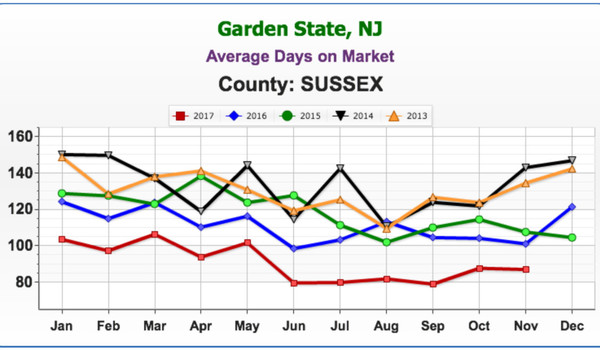
The faster things are selling, the hotter the market. Look for the lowest number on the graph as opposed to the highest. The calculation was changed in New York State. It’s now from the List Date to the Contract Date, rather than the Binder Date.
Sussex County: Consistently lower than the previous four years, November stats showed an average of 86.86 days on the market.
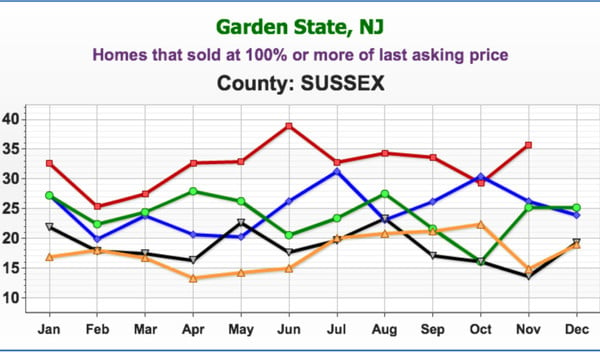
Homes that sold at 100% or more of last asking price
Sussex County: This number rose from October. 36.42% of homes sold at 100% or more of their last asking price – more than one-third!
Average Price
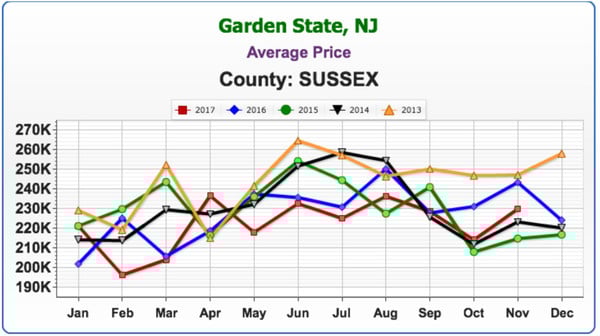
Sussex County: Despite the market being hot, prices have gone down since 2013, when the average price was $243,909. In 2017, it’s $221,994. November has seen a rise in average price to $229,779 from $214,056 in October. On average, prices are lower this year than the last four years. So it is essential to look at hyper-local comparables when pricing a home for a client.
What do these stats mean for buyers and sellers?
All the of above statistics show a market where sellers are in a strong position. A quarter to over a third of homes are selling at 100% or more of the seller’s last asking price. Homes are remaining on the market for shorter periods than any of the last five years. This is not a market where buyers have a strong upper hand when it comes to negotiating. Nor do they have the luxury of time. Thinking about selling? Now is a great time to find out what your home is worth.
The importance of a strong offer
With the shortage of inventory in today’s market combined with the above data, it has become increasingly important for buyers to come in quickly with a strong offer on the house they would like to call home! Buyers may not realize that increasing their offer by a few thousand dollars may only amount to an additional $20 or $30 in their monthly mortgage payment. Sellers may be receiving multiple offers. And other buyers may not be reticent about making a strong offer if they really want the house. It’s important to discuss your options with your real estate agent. Your agent will advise you on making that all important offer on the home that you want!


 Facebook
 X
X
 Pinterest
 Copy Link
