

 Facebook
 X
X
 Pinterest
 Copy Link

Green Team Business Review – March 2018
February’s numbers are in, we’re nearing the end of March, and the Scoreboards show the possible contenders for the first quarter sales leader awards. Based on actual numbers for January and February, the Warwick Scoreboard has Vikki Garby in the lead, followed by Nancy Sardo and Lucyann Tinnirello. In Vernon, Joyce Rogers leads Charles Nagy and Ted Van Laar. In Warwick, total sales volume is down slightly from January/February of 2017, while Vernon’s total sales volume is up by over $700,000 from the same period in 2017. However, if projections are correct, March will see sales volume increase in both Orange and Sussex Counties. March may also see shifts in the Scoreboard tallies.
This month’s business review meeting marked a Green Team first. The market stats were reviewed on Facebook Live (facebook.com/greenteamhq), giving agents and clients alike the opportunity to participate in real time. Geoff Green moderated the review, with panelists Angela Murphy and Terry Gavan commenting on the Orange County market and Pamela Zachowski providing commentary on the Sussex County market. Melissa Bressette, Green Team’s Marketing Director, also participated, with questions regarding the impact of rising interest rates on home sales.
Orange County, NY Real Estate Market Report – February 2018 Results
We are pleased to share with you a Housing Market Report from February 2018. We break down the local real estate activities and provide you with stats, graphs, and analysis of our local and regional real estate market. You can sign up on our website (www.greenteamhq.com) for monthly market updates. This month the market review was held on Facebook Live. You can visit our Facebook page to view the video, as well as informative posts. (www.facebook.com/greenteamhq/videos)
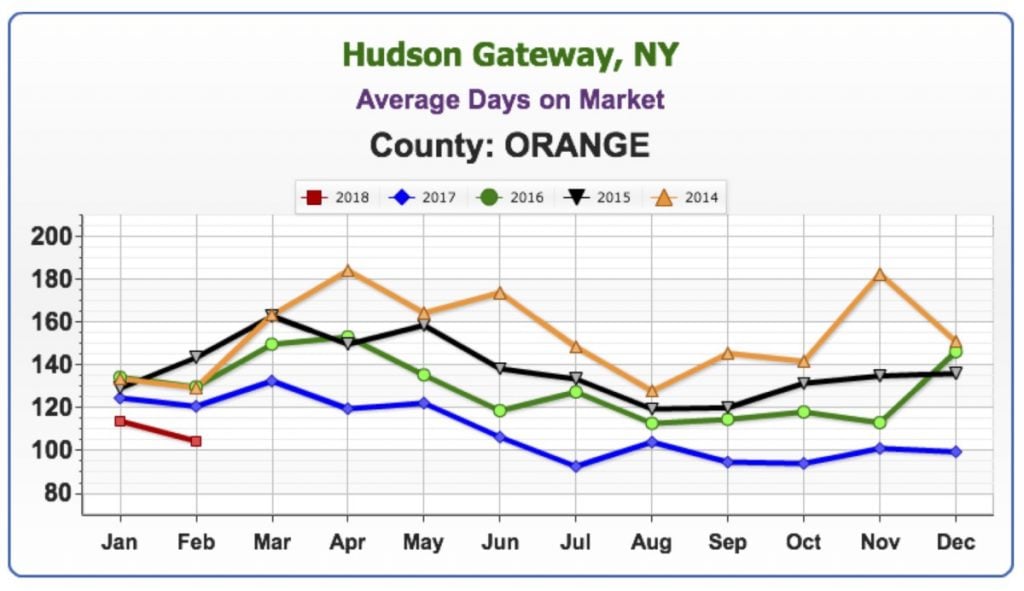
Average Days on the Market
The faster homes are selling, the hotter the market. Look for the lowest number on the graph as opposed to the highest. The calculation in New York State is from the List Date to the Contract Date.
The average number of days on the market for homes in Orange County continues to decline, which is good news for the market. In February, the average number of days on the market was 104.
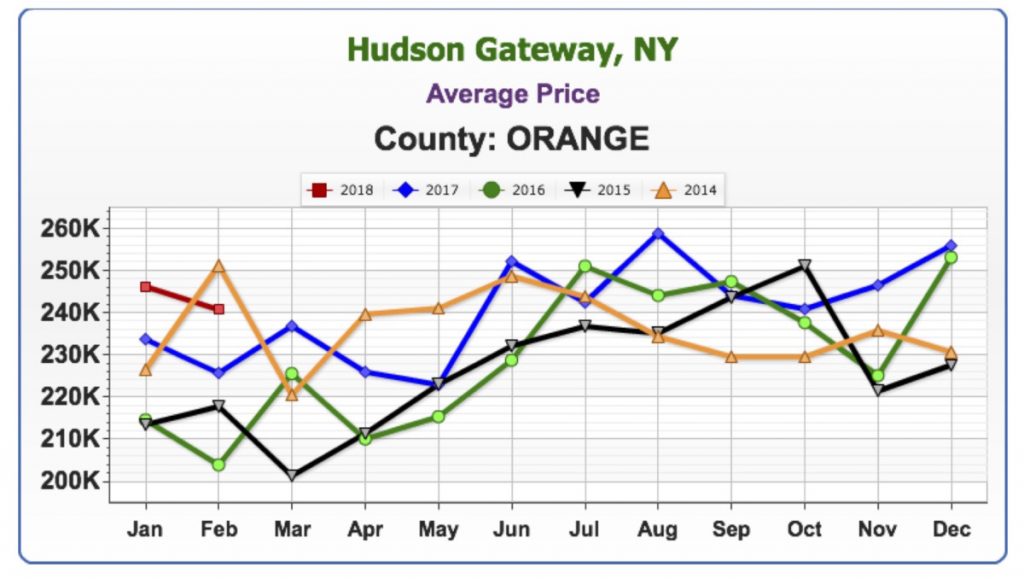
Average Price
Prices started coming back in July of 2017. There are Sellers with big mortgages on their homes who are patiently waiting, putting off retirement plans, etc., waiting for prices to come up more. When they do, inventory will open up. February of this year had the highest average price for a February since 2015.
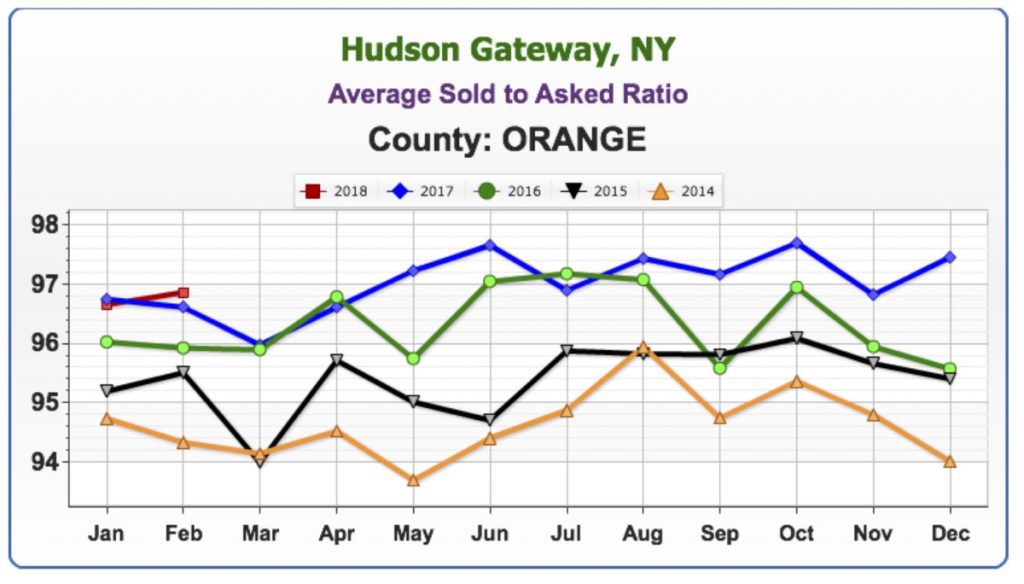
Average Sold to Asked Ratio
The percentage a house sold for under or over the last asking price (not the original price)
The average sold to asked ratio is on the rise. At 96.86%, this is the highest number for a February since 2014.
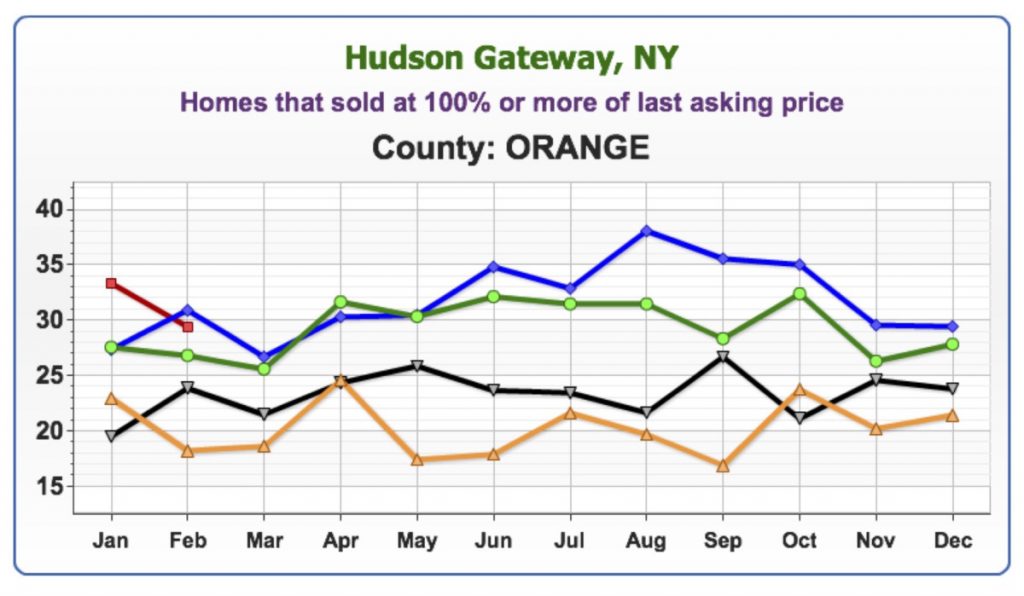
Homes that sold at 100% or more of last asking price
The stats came in just slightly lower than February of last year, but higher than February 2014-2016. 2017’s numbers were consistently the highest since 2014, and 2018 is continuing that trend, indicating a strong market.
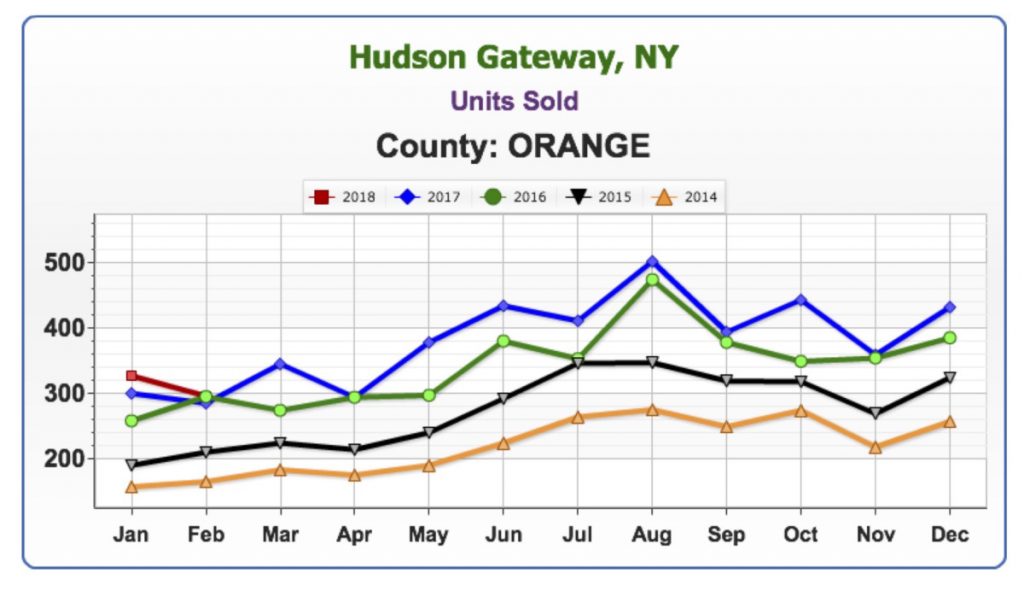
Units Sold
There were continual increases in January. While there was a slight log jam in February, the red line should consistently rise above the blue line for the rest of the year. It’s a healthy market place. According to Angela Murphy of the Green Team’s Warwick office, this is a strong, healthy market. There is a shortage of inventory, but no shortage of buyers. Additionally, most buyers don’t want to do work on a home. They are looking for turn-key properties. This is a good market for investors interested in flipping.
Note
Melissa Bressette, Marketing Director for the Green Team, asked what impact rising interest rates were having. According to Angela, despite rising interest rates, good connections with mortgage lenders can ease buyers’ minds and work with them on financing homes. Rates are still pretty low and affordable. If homes are priced correctly, there is usually a $10-$15,000 spectrum from asking price to where it’s sold. Comps of sold properties are more important than comps of properties that are for sale.


