[et_pb_section fb_built=”1″ admin_label=”section” _builder_version=”3.0.47″][et_pb_row admin_label=”row” _builder_version=”3.0.48″ background_size=”initial” background_position=”top_left” background_repeat=”repeat”][et_pb_column type=”4_4″ _builder_version=”3.0.47″ parallax=”off” parallax_method=”on”][et_pb_text admin_label=”Text” _builder_version=”3.0.74″ background_size=”initial” background_position=”top_left” background_repeat=”repeat”]
Covid19 has caused economic turmoil, health crises and uncertainty. However, a historical perspective may help us manage emotions and enable us to see what is happening in the housing market and navigate it accordingly. Below is a recording of the Housing Market Update as well as a summary of the most important discussion points.
National – Historical Perspective
Will this be like 2008, the start of the great recession?
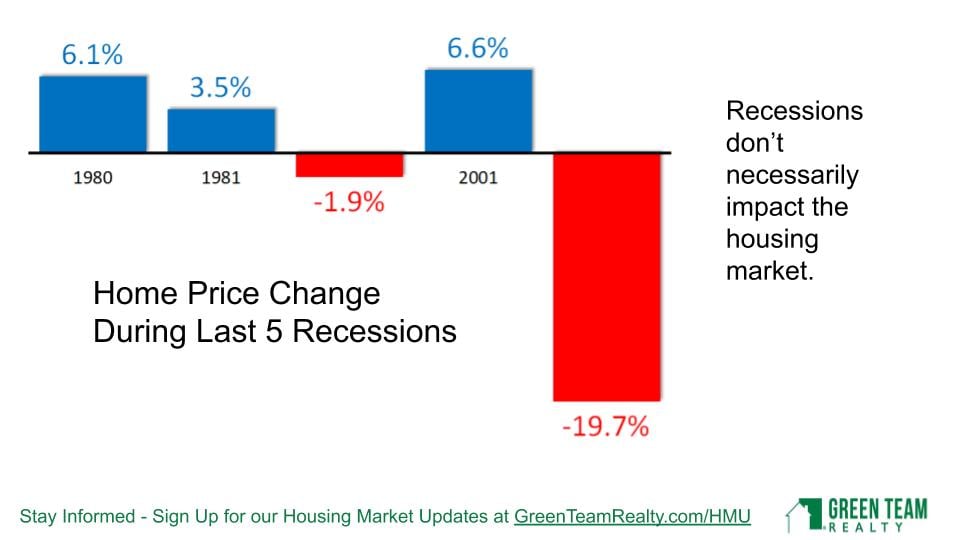
The Housing Market was greatly impacted at that time because it was the catalyst that caused the Great Recession. Home price changes during last 5 recessions indicate that recessions do not necessarily impact the housing market. In 3 of the last 5 recessions, housing markets actually increased.

Housing and Mortgage Crash
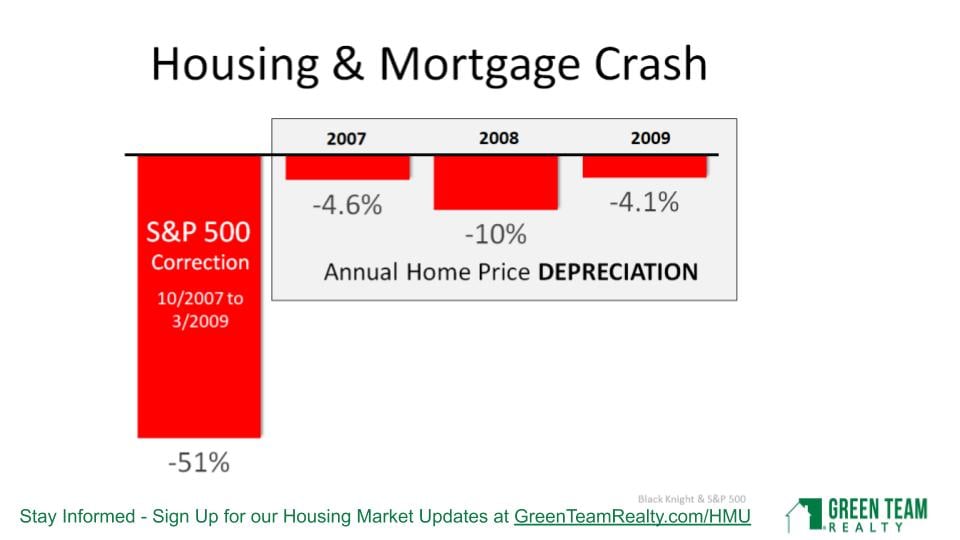
In 2007, 2008 and 2009, the annual home price depreciation was significant. However, at the time we were dealing with sub-prime lending, etc. However, looking further back, to the Dot.com crash and 9/11 market crash, there was a significant S&P 500 stock market correction. Yet prices in the housing market continued to increase. There were good fundamentals in place.
Annual Home Price Appreciation
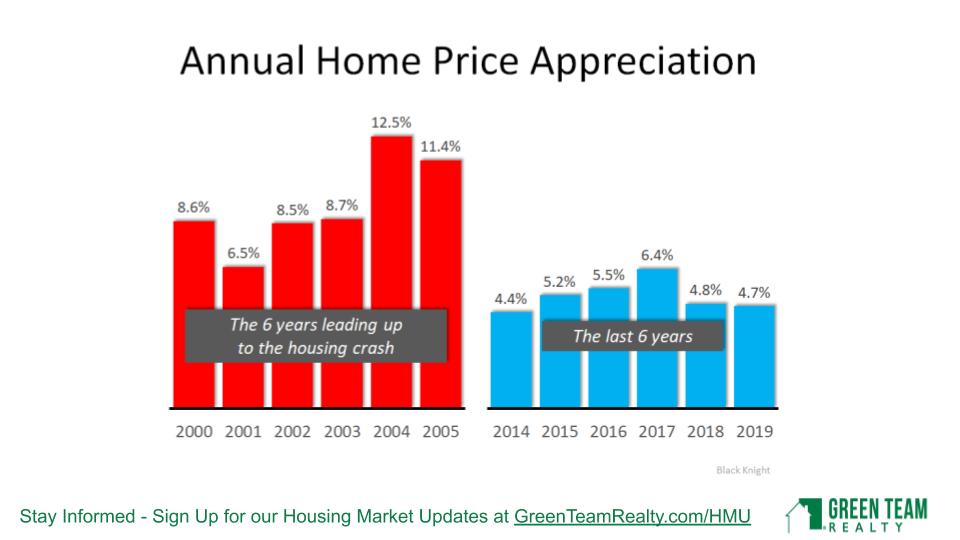
In any marketplace, you have to look at overall values. Are assets undervalued or overvalued? With the run-up to 2008, from 2000 to 2005, there were major price increases year over year. 6.5% was the lowest increase, with the highest being 12.5%. However, since 2014, 6.4% has been the highest increase. We haven’t gone back to those major subprime lending issues that happened before.

Mortgage Credit Availability and Affordability
The Great Recession required mortgage industry restructuring. That, in turn, led to qualified buyers not being able to borrow. This time around, it’s a different landscape. We don’t have a subprime lending bubble in the residential housing market. Loans will be processed for good buyers with good credit. Mortgage requirements are tightening a bit, but not to an unreasonable level. Another analytic compares total home equity cashed out in the years 2005-2007 and 2017-2019. People were using their homes “like ATMs” during the former period. The leverage people are putting on their homes has dropped from $824 Billion during 2005-2007 to $232 Billion during 2017-2019. 53.8% of all homes in America have at least 50% equity.
The percentage of median income needed to purchase a median-priced home has dropped from 25.4% in 2006 to 14.8% today. Affordability is in much better shape, largely due to mortgage rates being very low.
The Impact of Unemployment
Concerns about job losses are very real. A breakdown of the April 3 Unemployment Report shows the different sectors affected. 59.5% are from restaurant services and drinking places. The accommodation industry, retail trade, temporary help services, child daycare workers, health care office workers and construction workers make up most of the balance. In other words, these are jobs that should be coming back as soon as these businesses can operate again. It may take some time until people are confident and comfortable enough to get back out there. The next numbers come out on May 8, 2020 and will be discussed during the May HMU.
Unemployment rates and home sales do not seem to have a direct relationship. Current Unemployment Rates were compared to past financial crises. In 1933, during the Great Depression, unemployment rates were at a high of 24.9%. Goldman Sachs is predicting unemployment to be 15% in 2020. They are also predicting that number to go down to 6-8% in 2021, 5% in 2022 and 4% in 2023.
Based on data from the US Department of Labor accessed by Haver Analysis, the current employment situation is more like a natural disaster than a recession. The problem is how long this natural disaster, Covid19, is going to last. There are many unknowns, and no answers. We’ll be tracking what happens as parts of the economy reopen.
Historical look at Existing Home Sales Price
The market was hot the first two months of 2020, with average home sale price higher in January and February than those months in the preceding four years. It will be interesting to see what the numbers show over the next several months.

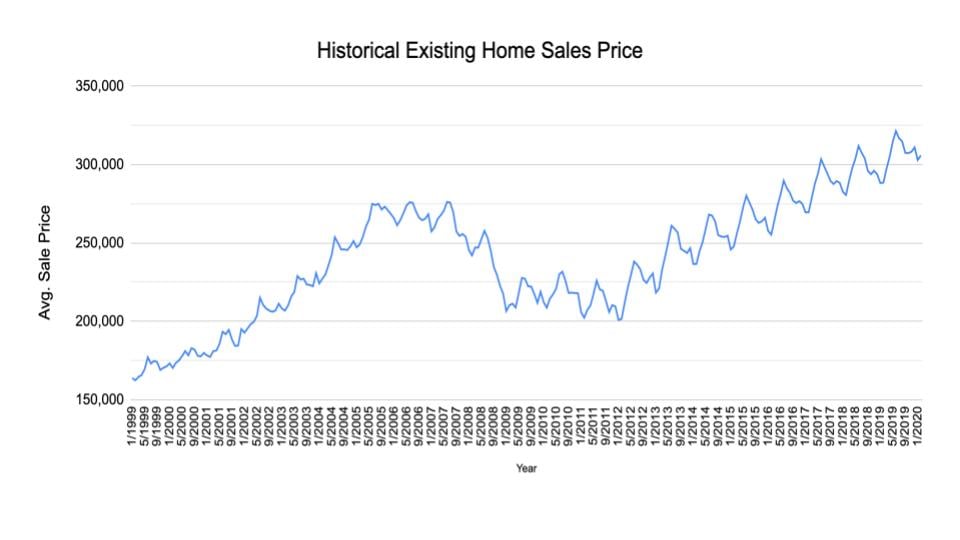
The above analytic shows Existing Home Sales Prices from January 1999 to January 2020. Even if you bought at the peak of 2007 or 2008, as Geoff did, just before the housing market plunged, it took 8 years for the market to recover. Historically speaking, people moved after an average of 6 years. That number is now inching up to 9 years. The average homeowner generally doesn’t buy or sell during a period of up or down. They want to wait and gain equity in their home. However, if you are not going to buy, what will you do? Rent? If so, you’re not building equity, you’re not getting tax write-offs, and other benefits of home ownership.
Inventory
In 2007, there were 8.2 months of inventory. Right now there are 3.1 months of inventory available. The market is much hotter now than in 2007 (leading into the Great Recession). Geoff believes that now is a very good time to buy, and not a bad time to sell, either, as inventory levels are so low. Historically, 6 months of supply is an average market. We are now down to 3 months of inventory. He does not see this number climbing anytime soon. Many sellers are not putting their homes on the market now, wanting to wait and see what will be happening. And, while people have to weigh their options, the low inventory can benefit those putting their home on the market.
April 2020 Local Stats
Orange & Sussex Counties
In Orange County, Units Sold were actually better in March than in February. Average Sales Price was way up. In Sussex County, Units Sold and Average Sales Price both coming out at a good solid pace. It will be interesting to see what the stats reflect when we take a look at our next Housing Market Update. At that time we’ll see the impact of Covid closures and stay-at-home regulations.
Housekeeping Items

Panel Discussion
Geoff Green was joined by Ken Flood of Quest Financial Services and Ken Aulicino of Family First Funding LLC. Vikki Garby and Carol Buchanan of Green Team New York Realty and Keren Gonen of Green Team New Jersey Realty represented the real estate agents’ points of view. Discussion ranged from the current state of commercial and residential real estate markets. There was positive feedback on how agents are adapting to the Covid19 regulations and are still able to assist clients and close deals. All three agents spoke of strong, serious buyer interest. Ken Flood discussed the financial market and Ken Aucilino the mortgage industry. Because of the wealth of information and graphics as well as the fascinating panel discussion, it is highly recommended that you watch the webinar. Click here to view the April 2020 Housing Market Update.
Remember to sign up below for the next Housing Market Update
[/et_pb_text][et_pb_agentfire_lead_form form=”contact” _builder_version=”3.18.2″][/et_pb_agentfire_lead_form][/et_pb_column][/et_pb_row][/et_pb_section]


 Facebook
 X
X
 Pinterest
 Copy Link


