

 Facebook
 X
X
 Pinterest
 Copy Link
Housing Market Review January 2018

There are three things we should look at:
- #1 New home sales are at the highest level in a decade.
- #2 Sales of previously owned homes are at the highest level in more than a decade.
- #3 Starts of single-family homes are the strongest in a decade and applications to build such properties advanced at the fastest pace since August 2007. More than a decade.
Whether we’re looking at new home sales, existing home sales, or new construction home starts, all the numbers are greater than they have been in at least the last ten years. So we can see that 2017 finished off very strongly, and many in the industry believe 2018 is going to be a great year. There are a couple of things that we have to take a look at as we move into 2018. First, let’s take a look at mortgage rate projections.

If we look all the way to the right of the chart above you’ll see the average of all four projections. Now look at the 2018 fourth quarter forecast and we see that the projected average is over 4 1⁄2%.
Currently, interest rates are sitting just about 4%.
Will this impact the market? The chart below shows total home sales for 2017 and what each of the top industry experts is projecting for 2018.

As you can see, National Association of Realtors, Freddie Mac, the Mortgage Bank Association and Fannie Mae all see a dramatic increase in the number of houses sold in 2018. It’s clear to see that the experts who came up with these projections don’t seem to think that’s the market will be affected by an increase in interest rates.
Probably the most important thing we can look at as well is “What does the buyer think right now“.

We can see from the Buyer Traffic chart above (December numbers aren’t in yet) that in September, October, and November of 2017, there was more buyer traffic, more buyer activity, than at any time at all during the rest of the year. Including the spring buyer’s market (March, April, and May). So, there are more buyers out there right now shopping for houses than there was last spring.
Wrap-up
Experts are saying they believe that 2018, as long as more listing come into the market, could be a phenomenal year. As a matter of fact, Bloomberg Business said this: “America’s housing market is gearing up for a robust year ahead. Builders are more optimistic, demand is strong and lean inventory is keeping prices elevated.
Get a closer look at your local real estate market
Housing Market Report – Orange County, NY
Housing Market Report – Sussex County, NJ
Orange County, NY Real Estate Market Report for Dec 2017
Housing Market Report – Orange County, NY
We are pleased to share with you a Housing Market Report from December 2017 as well as a look at the trends for the entire 2017 year. We break down the local real estate activities and provide you with stats, graphs, and analysis of our local and regional real estate market.
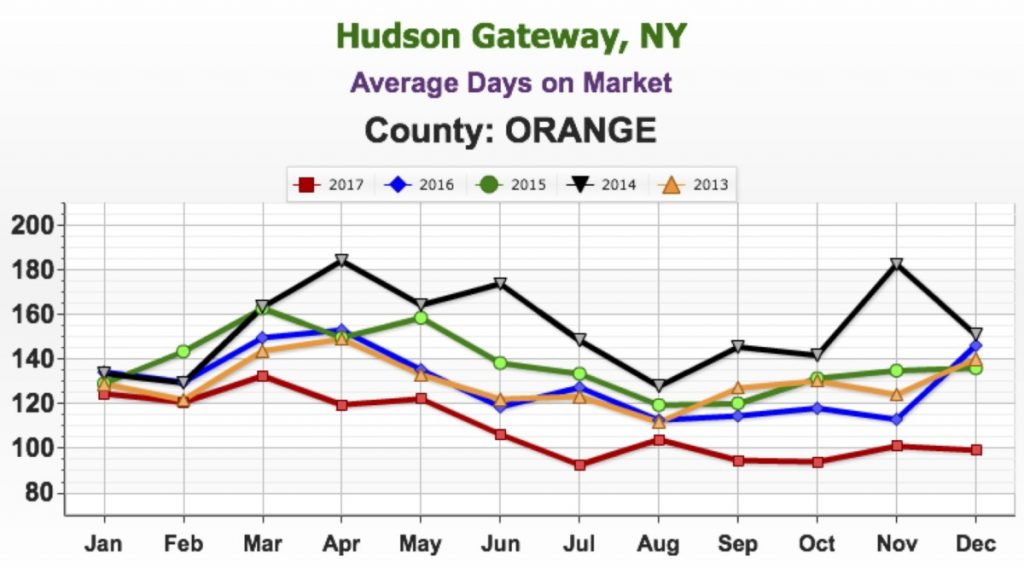
Average Days on the Market
The faster things are selling, the hotter the market. Look for the lowest number on the graph as opposed to the highest. The calculation was changed in New York State. It’s now from the List Date to the Contract Date, rather than the Binder Date.
With the average number of days on the market continuing to decrease, the market continues to sizzle! The average number of days a home was on the market in Orange County was 99.15 in December. 2017 has consistently had the lowest number of days on the market for all years since 2013. At or below 100 days on market average for approximately half the year are solid numbers.
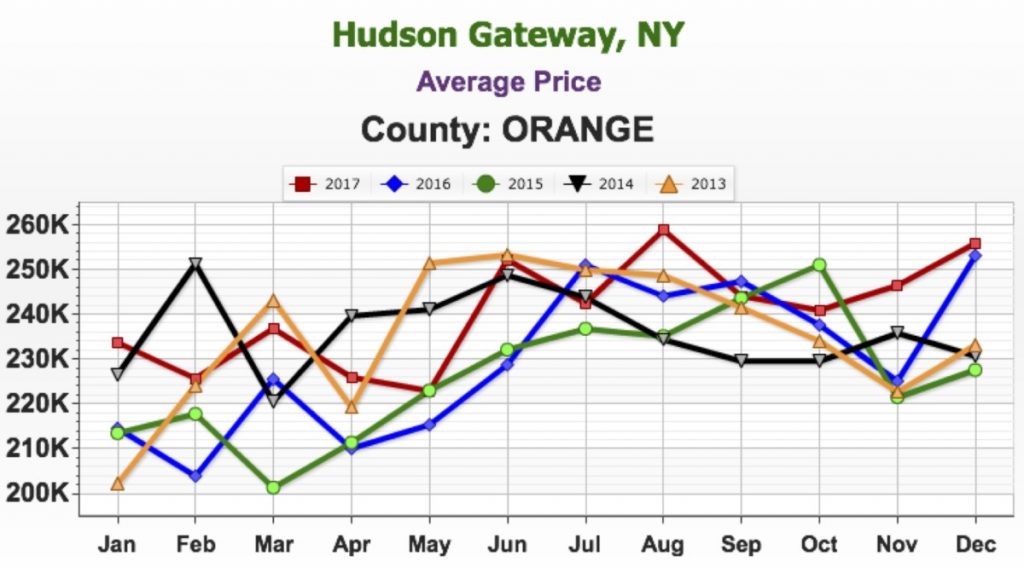
Average Price
An upward trend is finally appearing, at or above all previous years since 2013. Prices are coming up, which should hopefully unlock some inventory. There are people who have been holding off selling their home, many waiting to retire to warmer climates, waiting until they could get a higher price for their homes.
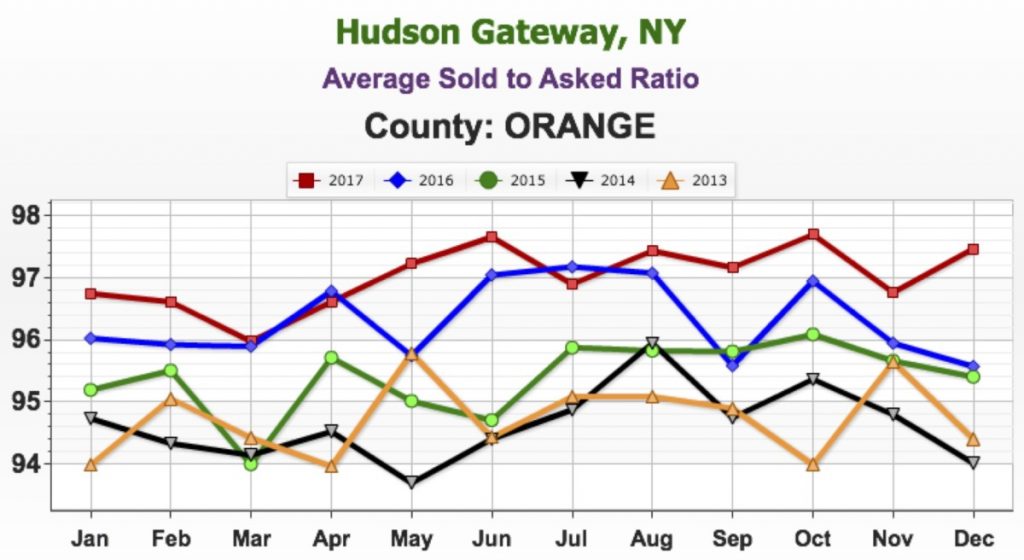
Average Sold to Asked Ratio
The percentage a house sold for under or over the last asking price (not the original price).
The higher the number, the hotter the seller’s market.
On average, sellers are having to negotiate less than 3% off of their last asking price. This is a solid trend higher than any of the previous 4 or 5 years.
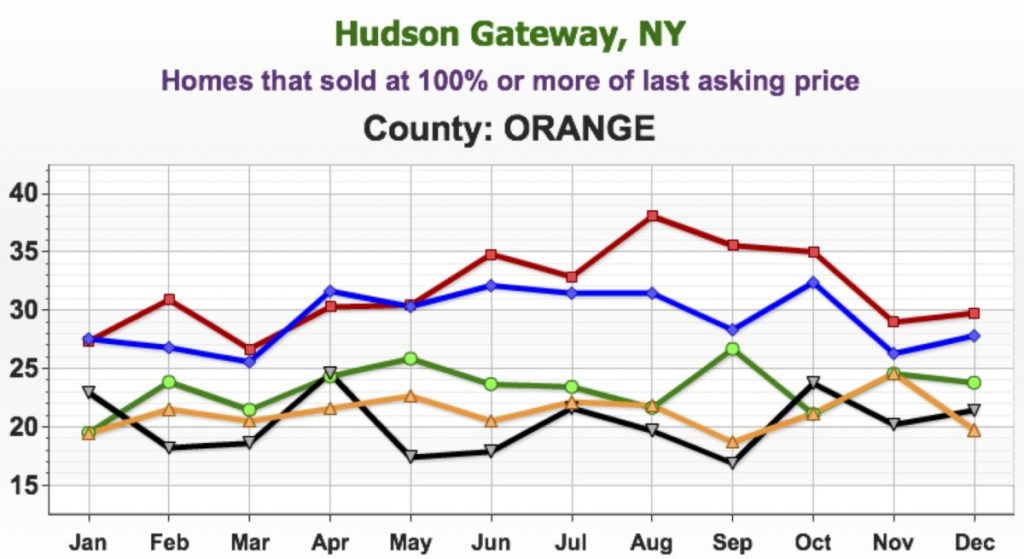
Homes that sold at 100% or more of last asking price
More than 30% of homes sold at 100% or more of their last asking price, another indicator of a strong market.
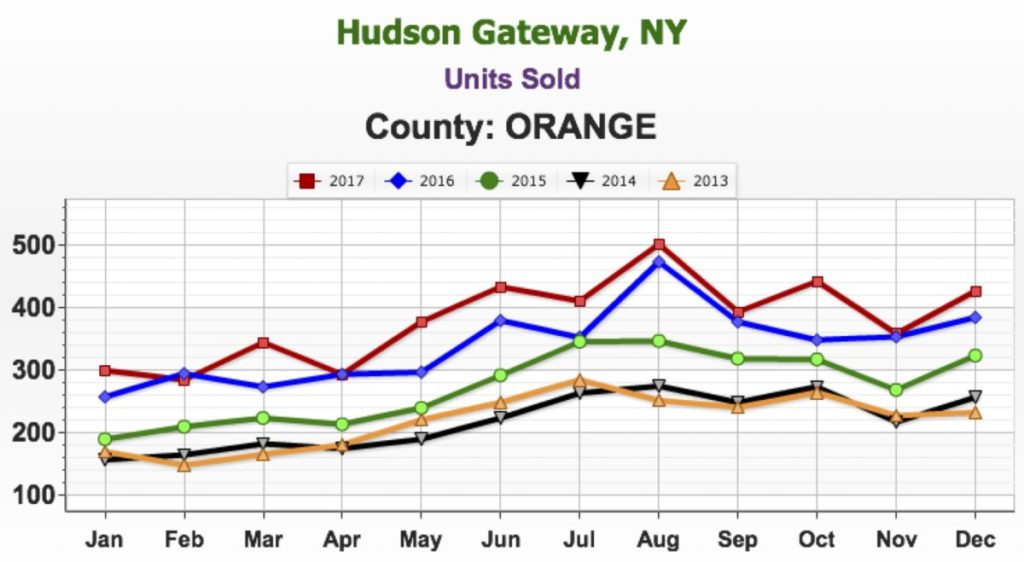
Units Sold
The term units here includes single family homes, condominiums, town house and multi-family homes with 1-4 units.
The most important indicator of a strong market is the number of units being sold. The transaction numbers continue to be solid, above the last four years.
[gravityform id=”16″ title=”true” description=”true”]


